Bitcoin, Ethereum, and Ripple: Price Predictions and Market Movements You Need to Know!

Bitcoin, Ethereum, and Ripple: Price Predictions and Market Movements
Bitcoin (BTC) is currently facing resistance around the $101,109 level, indicating a possible downturn. Meanwhile, Ethereum (ETH) is on the verge of a potential rally if it can close above $4,000, and Ripple (XRP) is finding support at $1.96, where a breakdown could signal further declines.
Bitcoin Bulls Show Signs of Weakness
Bitcoin recently faced rejection at $101,109, leading to a 1.11% decline. As of Friday, BTC trades just below $99,700. If resistance at $101,109 persists, a further decline may retest the psychologically significant level of $90,000. The Relative Strength Index (RSI) is currently at 60, suggesting weakening bullish momentum. Should the RSI close below 50, it could indicate a bearish trend.
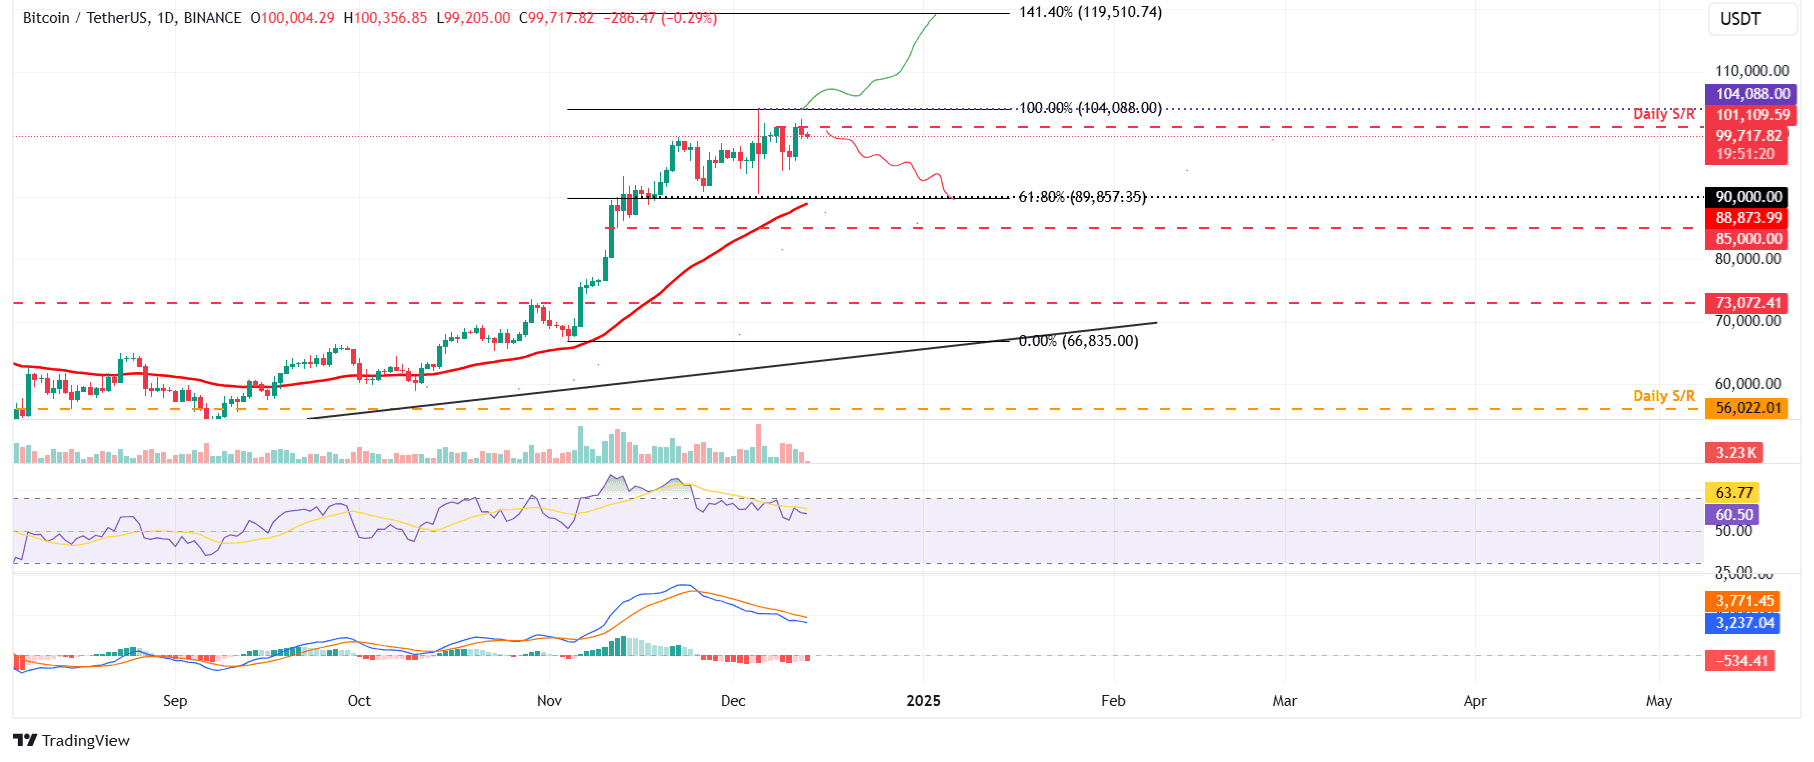 BTC/USDT daily chart
Conversely, if BTC manages to close above $104,088, it could potentially rally toward a new all-time high of $119,510.
Ethereum Price Looks Promising
Ethereum faced rejection around $4,000 on December 6 but has since rebounded from a 9.2% decline, retesting support at $3,522. Currently trading near $4,000, a successful break above this level could lead to a 12% rally, targeting the December 9, 2021, high of $4,488. The RSI reading of 62 indicates that bullish momentum is gaining strength.
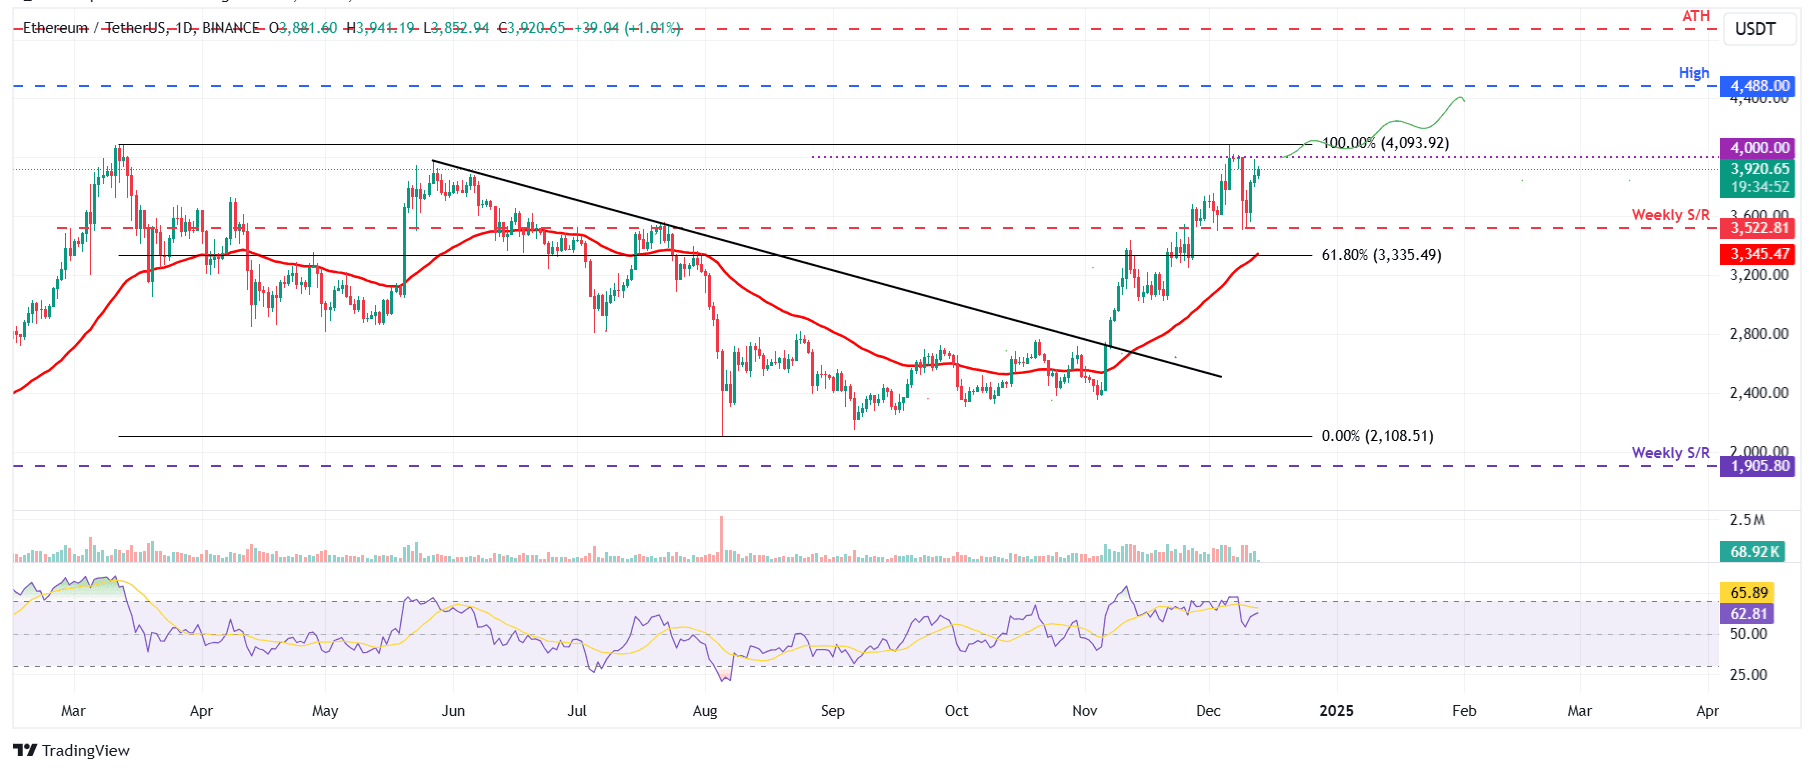 ETH/USDT daily chart
However, a rejection at $4,000 could see ETH decline back to its support level at $3,522.
Ripple Could Face a Decline if It Closes Below $1.96
Ripple has encountered resistance around $2.66, leading to a 15% drop. Currently hovering around $2.32, XRP's support at $1.96 is critical; a close below this level could trigger a further drop to $1.40. The RSI reading of 62 indicates a weakening bullish trend, supported by a bearish crossover in the MACD indicator.
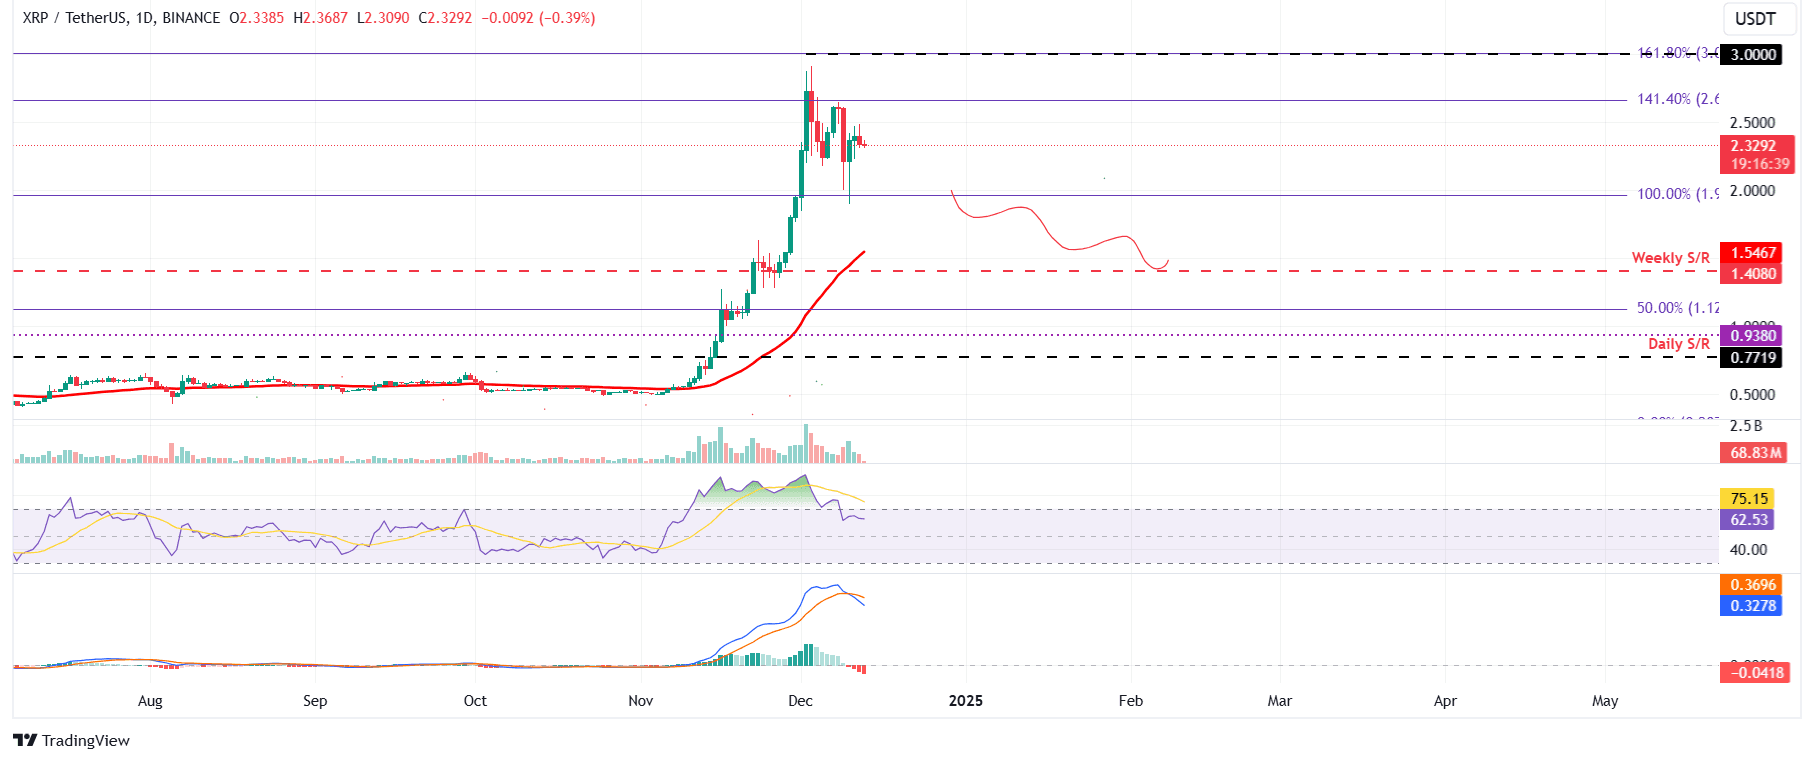 XRP/USDT daily chart
If XRP can rally and close above $2.66, it may retest the key level of $3.00.
- #bitcoin
- #ethereum
- #ripple
- #marketanalysis
- #cryptocurrency
Comments · 0