Bitcoin, Ethereum, and Ripple: What's Next for Prices Amidst Market Consolidation?
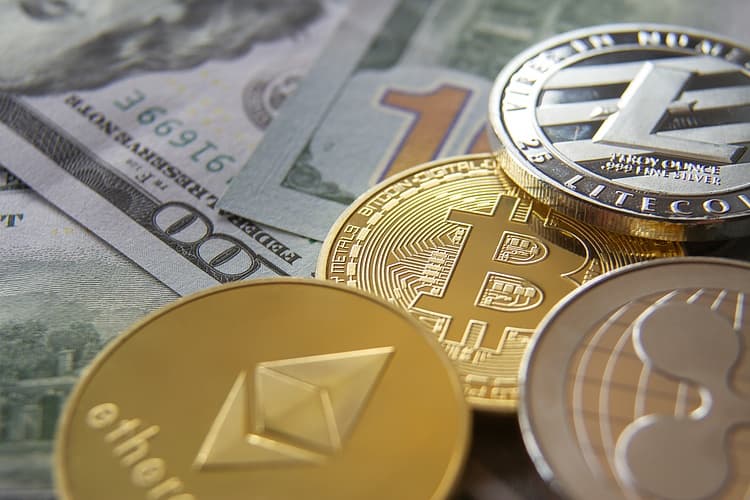
Bitcoin Price Stalls Between $57,000 and $62,000
Bitcoin (BTC) is currently consolidating between $57,115 and $62,066, with momentum indicators hinting at a potential bearish trend. The Fibonacci retracement levels of 38.2% and 61.8% indicate key resistance and support zones. As of now, BTC trades slightly higher at $58,499.
If Bitcoin approaches the 61.8% Fibonacci retracement at $62,066, it may encounter resistance due to the previously breached trendline and the 100-day Exponential Moving Average around $62,226. A failure to surpass this resistance could lead to a decline towards $57,115, with the potential of dropping 19% to revisit the $49,917 support level.

If Bitcoin manages to close above $62,066, it may target the August 2 high of $65,596, potentially leading to a 6% increase and testing the weekly resistance at $69,648.
Ethereum Faces Resistance Risk
Ethereum (ETH) is trading around $2,637, nearing its 50% retracement level at $2,843. If this level remains a resistance, a decline of 12% could see ETH testing the psychological support at $2,500.
The daily chart shows both the RSI and Awesome Oscillator (AO) trading below their neutral levels, indicating a potential bearish trend.

However, a close above $2,843 could drive ETH up to $3,396, establishing a higher high on the daily chart and possibly resulting in a 5% increase towards $3,562.
Ripple Shows Stability and Recovery Potential
Ripple (XRP) is currently stable around its daily support level of $0.544, trading slightly higher at $0.566. If this support holds, XRP could rally 10% to challenge the next resistance at $0.643.
The daily chart indicates that both the RSI and AO have slightly dipped below their neutral levels. A sustained position above these levels could signal a recovery rally.

Conversely, a close below $0.544 would create a lower low on the daily chart, potentially leading to a 9.5% decline towards the August 7 low of $0.492.
- #bitcoin
- #ethereum
- #ripple
- #marketanalysis
- #priceprediction
Comments · 0