Is Bitcoin Set to Soar? Price Predictions for BTC, ETH, and XRP Amid Market Buzz!

Bitcoin’s (BTC) price continues to trade green, trading above $100,900 on Friday after rallying almost 7% so far this week. Ethereum (ETH) and Ripple (XRP) followed BTC’s footsteps and bounced after retesting key support levels earlier this week, all hinting at a rally ahead.
Bitcoin Bulls Aim for an All-Time High of $108,353
Bitcoin price bounced after retesting its $90,000 support level on Monday and rose 5.77%, closing above the $100K in the next three days. At the time of writing on Friday, it continues to trade higher, around $100,900. If BTC continues its upward momentum, it could extend the rally to retest the December 17, 2024, all-time high of $108,353.
The Relative Strength Index (RSI) indicator on the daily chart reads 59, above its neutral level of 50, and points upwards, indicating a rise in bullish momentum. Additionally, the Moving Average Convergence Divergence (MACD) indicator flipped a bullish crossover on Wednesday, giving a buy signal and suggesting an uptrend.
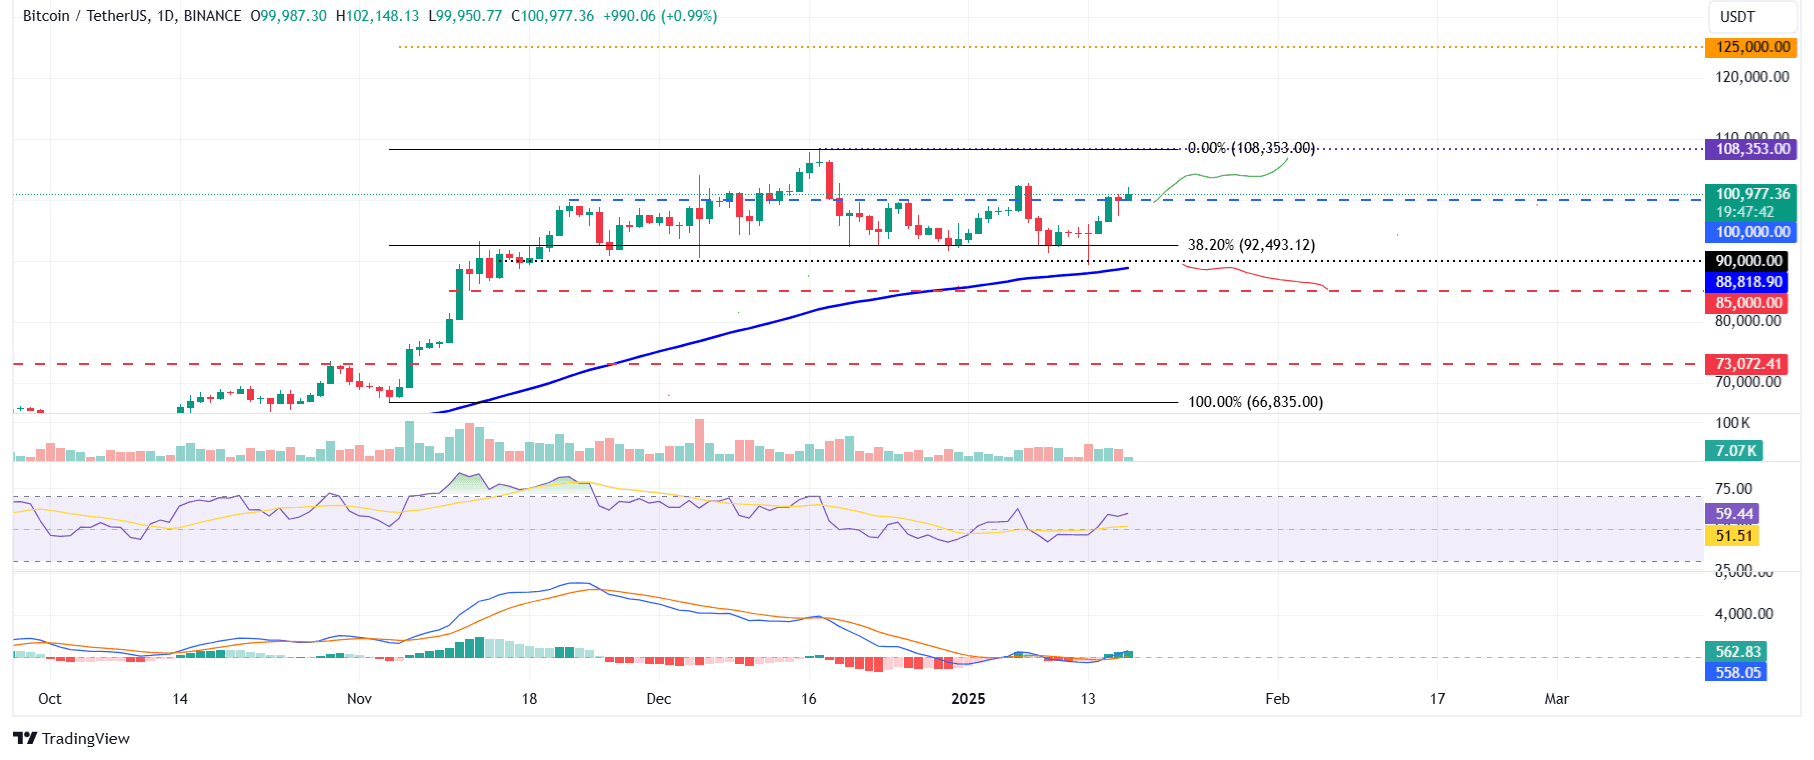
BTC/USDT daily chart
However, if BTC faces a pullback and closes below the $100,000 support level, it could extend the decline to retest its next support level at $90,000.
Ethereum Rebound After Retesting Its 200-Day EMA
Ethereum price rebounded and closed above its 200-day Exponential Moving Average (EMA) at $3,120 on Tuesday and rose 7.2% the next day. However, it declined 4% on Thursday, and at the time of writing on Friday, it hovers around $3,257. If the $3,120 EMA level holds, ETH could extend the recovery to test its daily resistance level at $3,730.
Conversely, if ETH closes below the 200-day EMA at $3,120, it could extend the decline to test its psychological importance level of $3,000.
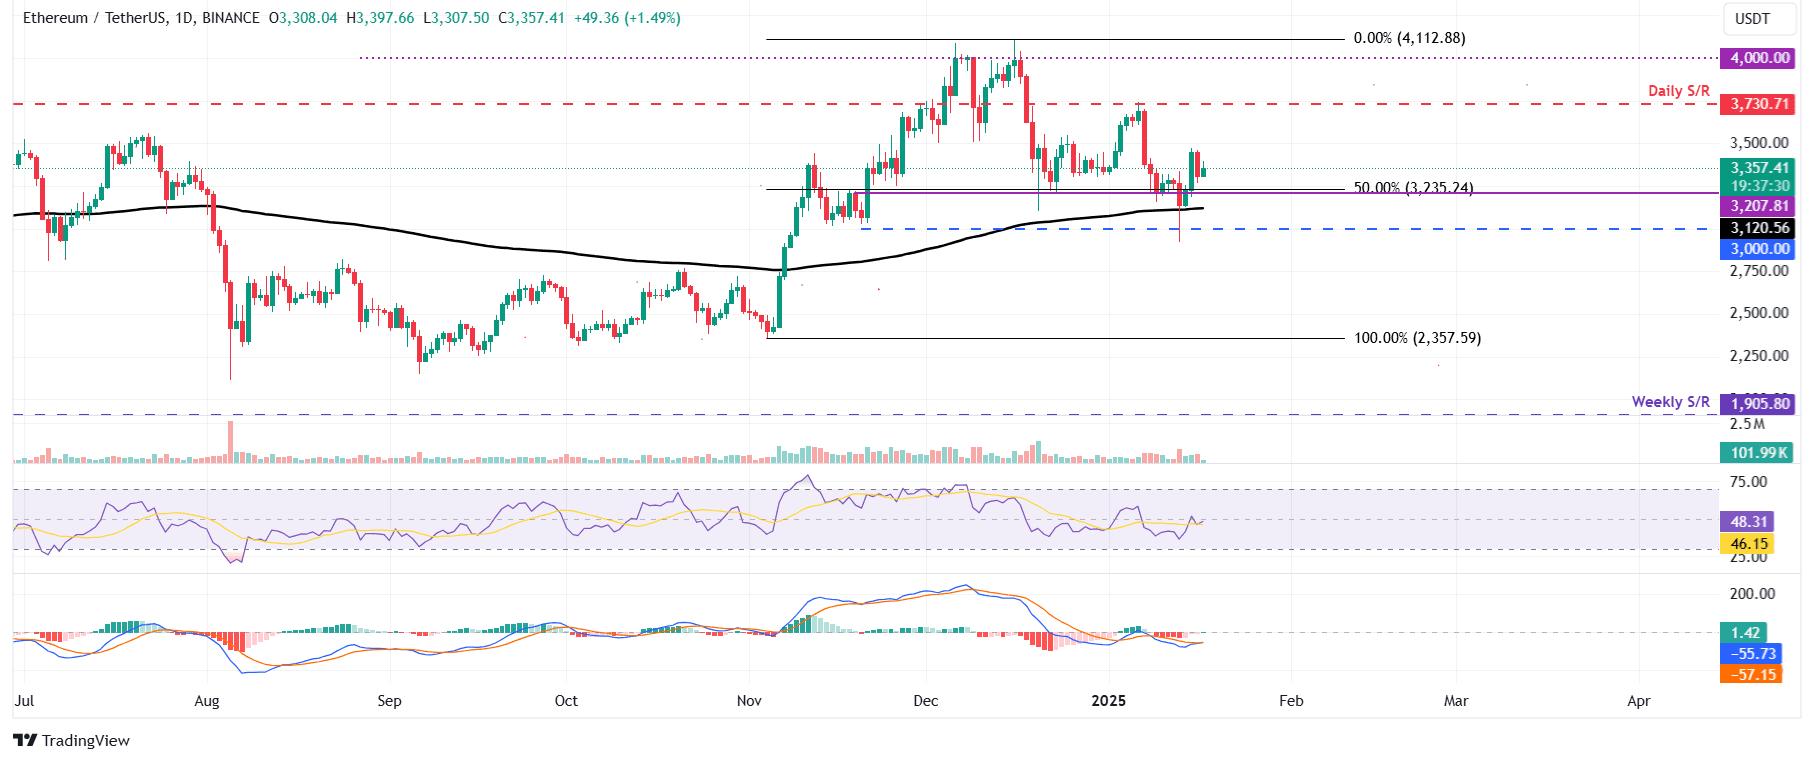
ETH/USDT daily chart
Ripple Bulls Could Aim for the Symmetrical Triangle Target at $3.63
Ripple price retested its upper symmetrical triangle boundary on Monday and rallied 28.6%, closing above its psychological importance level of $3.00 over the next three days. At the time of writing on Friday, it continues to trade higher, around $3.29. If XRP continues its upward momentum, it could extend the rally to test its technical target obtained by this pattern, which would be $3.63.
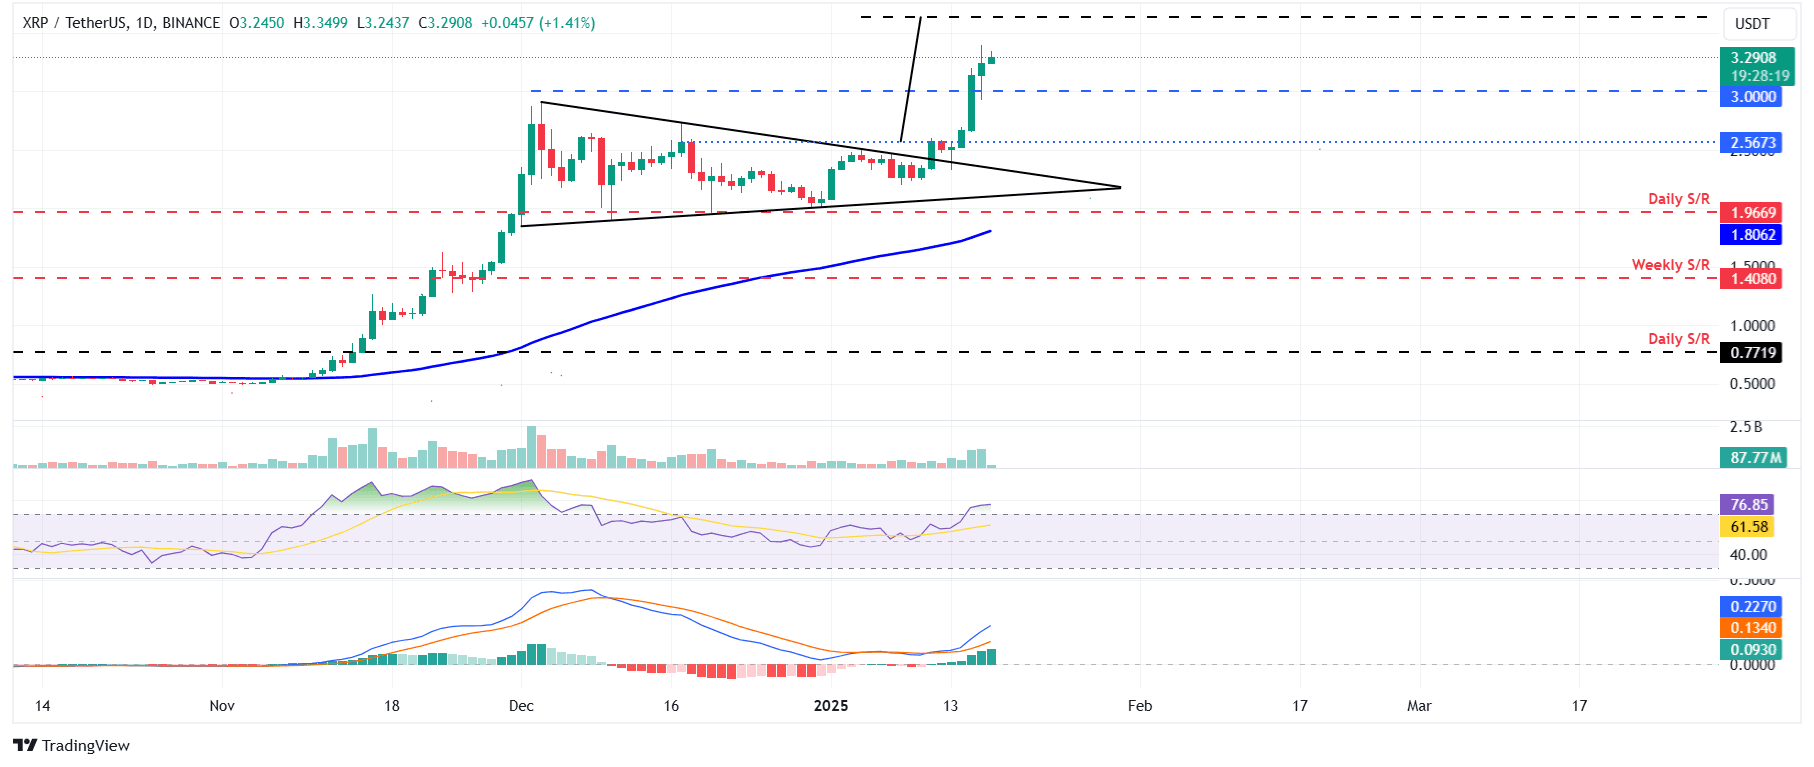
XRP/USDT daily chart
However, if XRP closes below the $1.96 daily support level, it would extend the decline to retest its next support level at $1.40.
- #bitcoin
- #ethereum
- #ripple
- #marketanalysis
- #cryptotrends
Comments · 0