Is Now the Perfect Time to Buy Bitcoin? Insights from MVRV and Rainbow Charts!


Bitcoin's Rainbow Chart Analysis
Bitcoin's rainbow chart indicates that BTC is currently in an accumulation phase. This metric suggests that now could be a prime opportunity for investors to consider buying BTC.
Current Market Status
According to CoinMarketCap, Bitcoin's price has seen a slight increase, currently trading at $61,107 with a market capitalization exceeding $1.20 trillion.
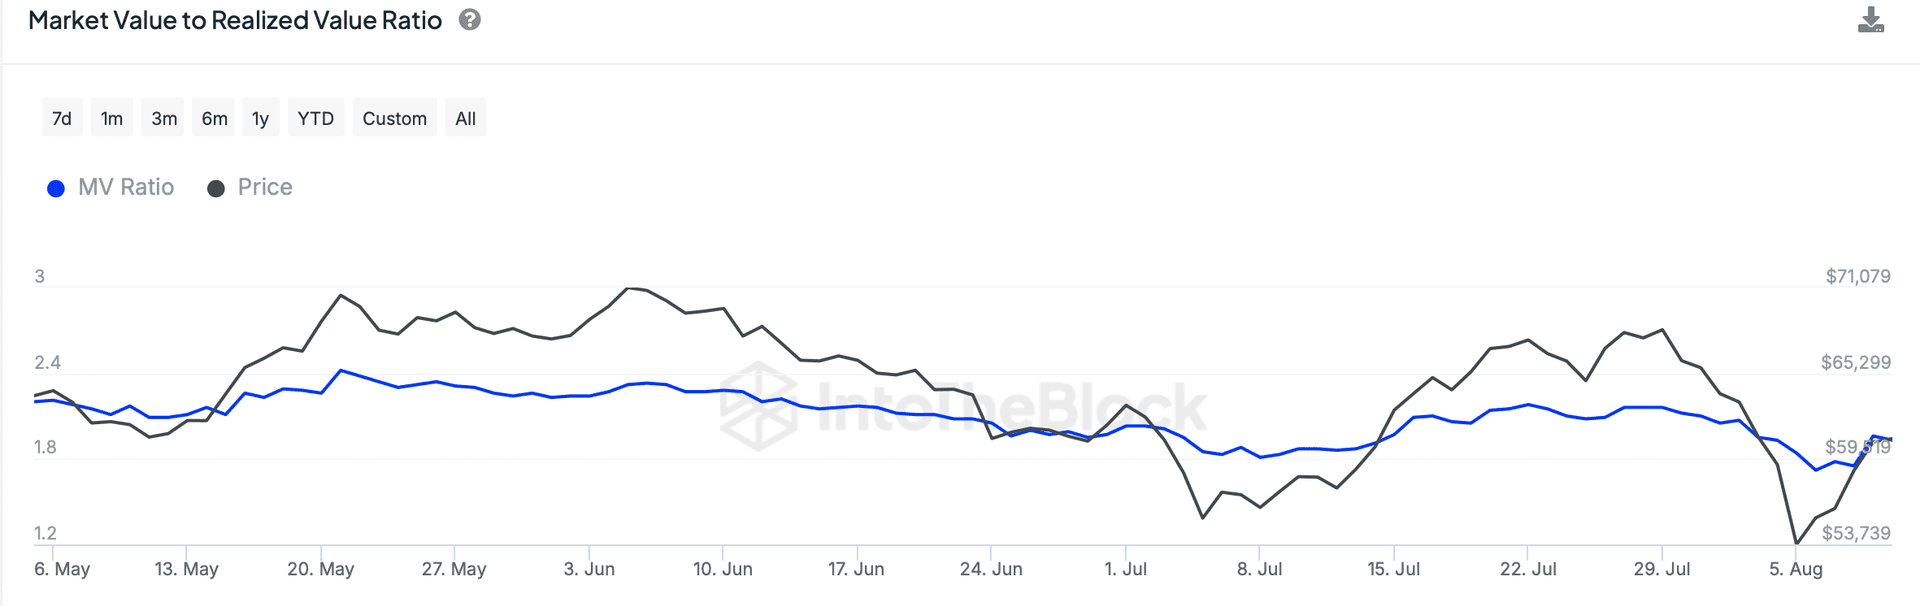
The MVRV ratio for Bitcoin stands at 1.93, indicating that it remains below the critical threshold of 3, suggesting a favorable buying opportunity may soon arise.
Investor Sentiment and Accumulation
Recent data from Santiment shows that Bitcoin's supply on exchanges has decreased, reflecting increased buying pressure. Notably, there was a significant spike in exchange outflows on August 9, confirming that investors are actively accumulating BTC.
However, it's important to note that despite this accumulation, the weighted sentiment surrounding Bitcoin has turned negative, indicating a rise in bearish sentiment.
Technical Analysis
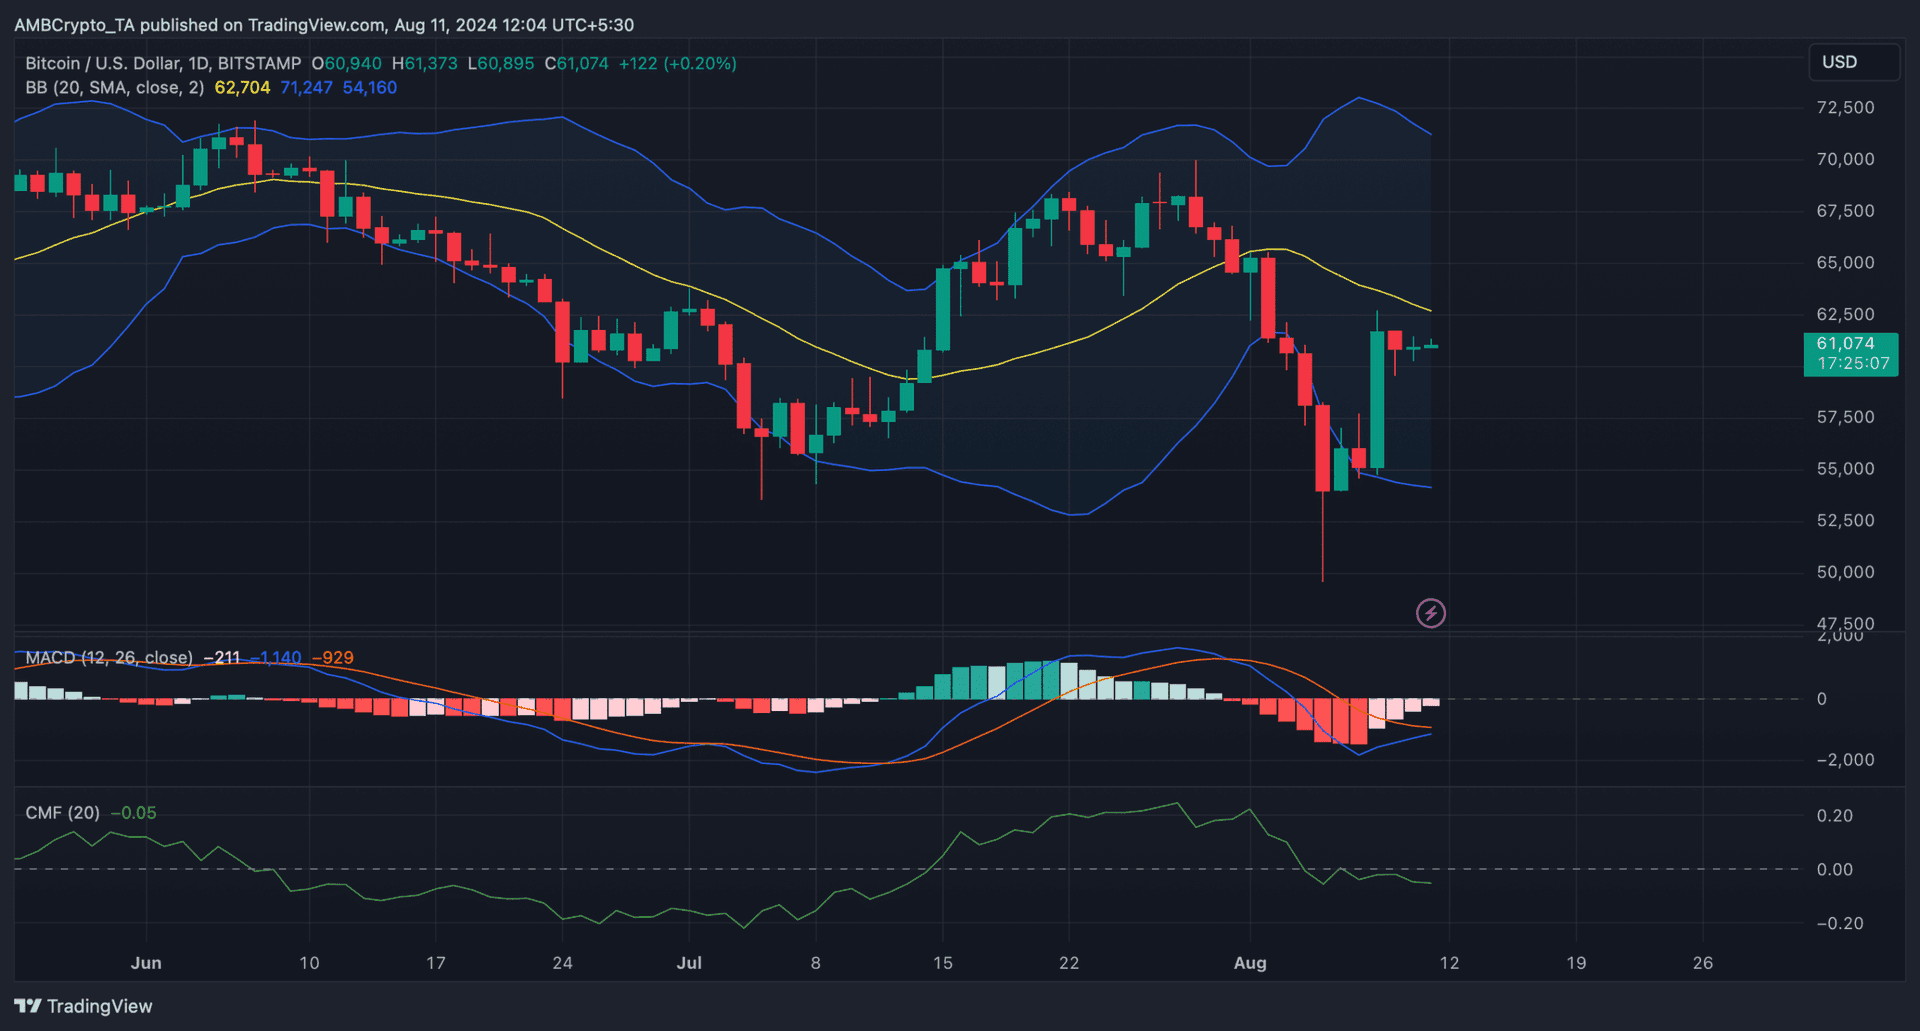
Looking at the technical indicators, Bitcoin's Chaikin Money Flow (CMF) has shown a sharp decline, hinting at a potential bearish takeover. Currently, BTC is testing its 20-day Simple Moving Average (SMA), while the MACD shows signs of a possible bullish crossover, which could allow BTC to break above the SMA.
Stay tuned for further updates as we continue to monitor these critical metrics and market movements!
- #bitcoin
- #crypto
- #marketanalysis
- #investing
- #technicalindicators
Comments · 0