The Bitcoin Crossover That Could Signal a Bull Run: Analyst Insights

Analyst Insights on Bitcoin Metrics
An analyst has explained how a crossover between two key Bitcoin metrics is crucial before the real excitement can begin for the asset.
Bitcoin Realized Price vs. 200-Week MA
In a recent post on X, analyst James Van Straten discussed the significance of the Realized Price and the 200-week moving average (MA) for Bitcoin. The Realized Price is an on-chain indicator that tracks the average acquisition price of Bitcoin holders. When the spot price exceeds this metric, it indicates that holders are in a state of net unrealized profit. Conversely, when it falls below, it suggests the market is largely at a loss.
The 200-week MA is a critical technical analysis tool that averages the price over a long period, smoothing out short-term fluctuations and revealing long-term trends.
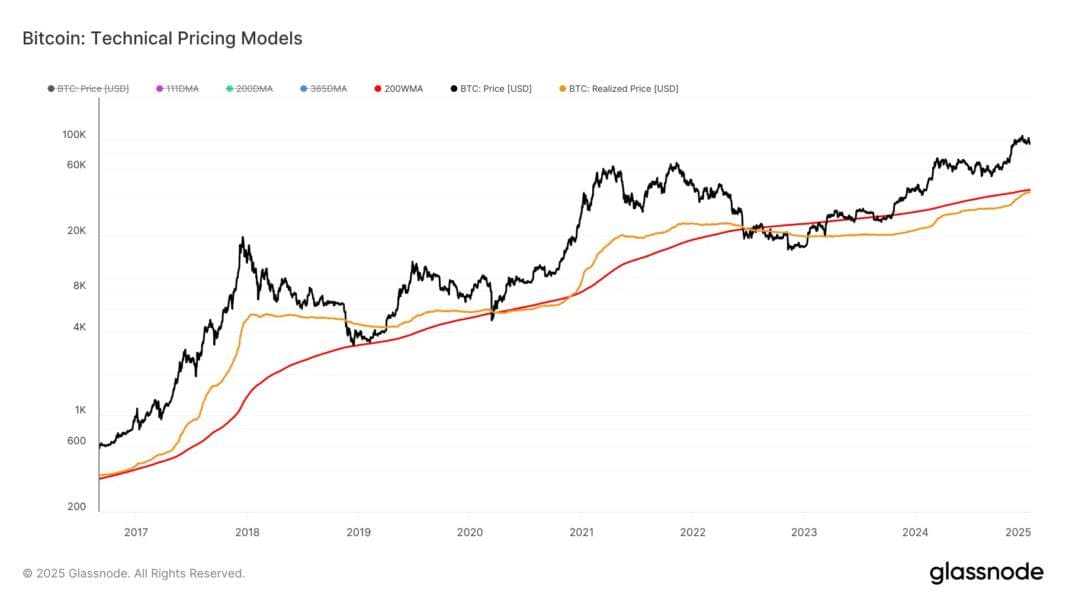
As illustrated in the graph, the Bitcoin Realized Price dropped below the 200-week MA during the 2022 bear market and has remained under this level since then, although it is now approaching a retest. Previous instances where the Realized Price crossed above the 200-week MA have historically led to significant bull runs for Bitcoin. Van Straten notes, “When the realized price flips the 200WMA the fun begins.”
This potential crossover could indicate a bullish trend for Bitcoin in the current cycle, but whether the Realized Price will surpass this level soon remains uncertain. Historically, the Realized Price has acted as a boundary for bear market lows, with few sellers remaining once the price falls below this metric.
BTC Price Update
Bitcoin has recently surged, recovering to the $96,600 mark after dipping below $90,000 just yesterday.
- #bitcoin
- #marketanalysis
- #cryptotrends
- #bullrun
- #investment
Comments · 0