
Bitcoin Faces a Critical Resistance Level
Bitcoin price is currently testing a crucial resistance level around $62,000. This level has proven to be a significant barrier, as the price has been repeatedly rejected around the 61.8% Fibonacci retracement level of $62,066. Currently trading at $58,564, Bitcoin shows potential for a decline if it cannot break through this resistance.
If the $62,066 level holds, we may see an increase in selling pressure, possibly leading to a 19% drop to retest the $49,917 support level. Momentum indicators like the Relative Strength Index (RSI) and Awesome Oscillator (AO) are suggesting bearish dominance, trading below neutral levels.
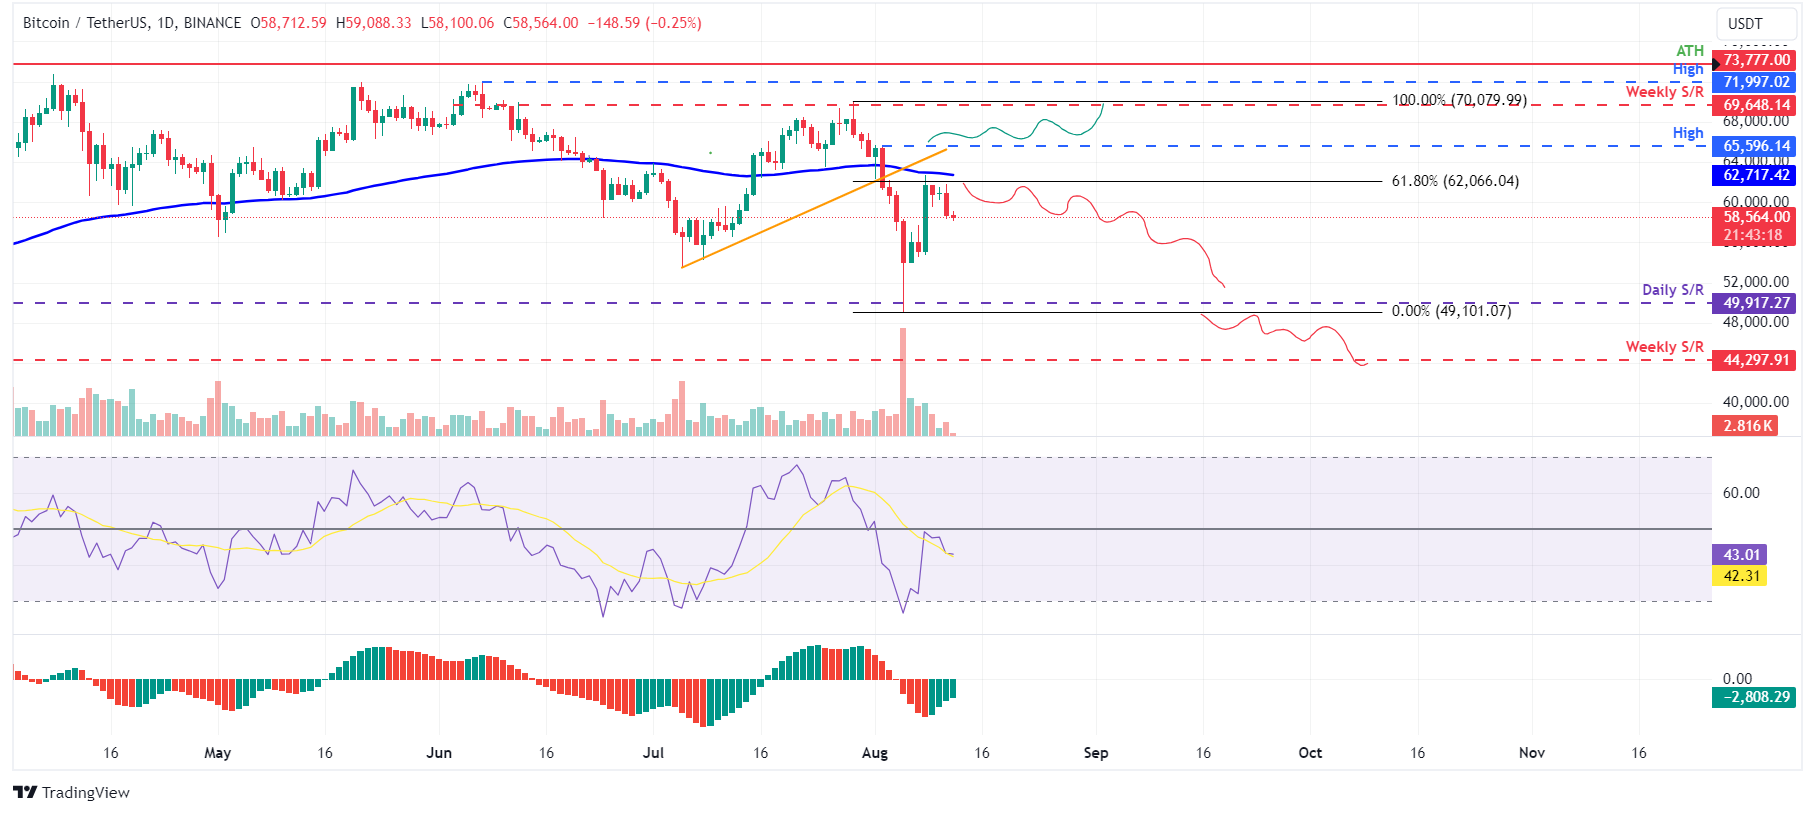
BTC/USDT daily chart
Conversely, if Bitcoin manages to close above $65,596, it could establish a higher high, potentially driving a 6% increase toward the $69,648 resistance.
Ethereum's Price at Risk
Ethereum is facing a significant resistance barrier around $2,843, derived from the 50% retracement level. Currently trading at $2,537, Ethereum may drop 25% if it fails to surpass this resistance, potentially testing its weekly support at $2,118. The bearish sentiment is further supported by the RSI and AO indicators falling below their neutral thresholds.
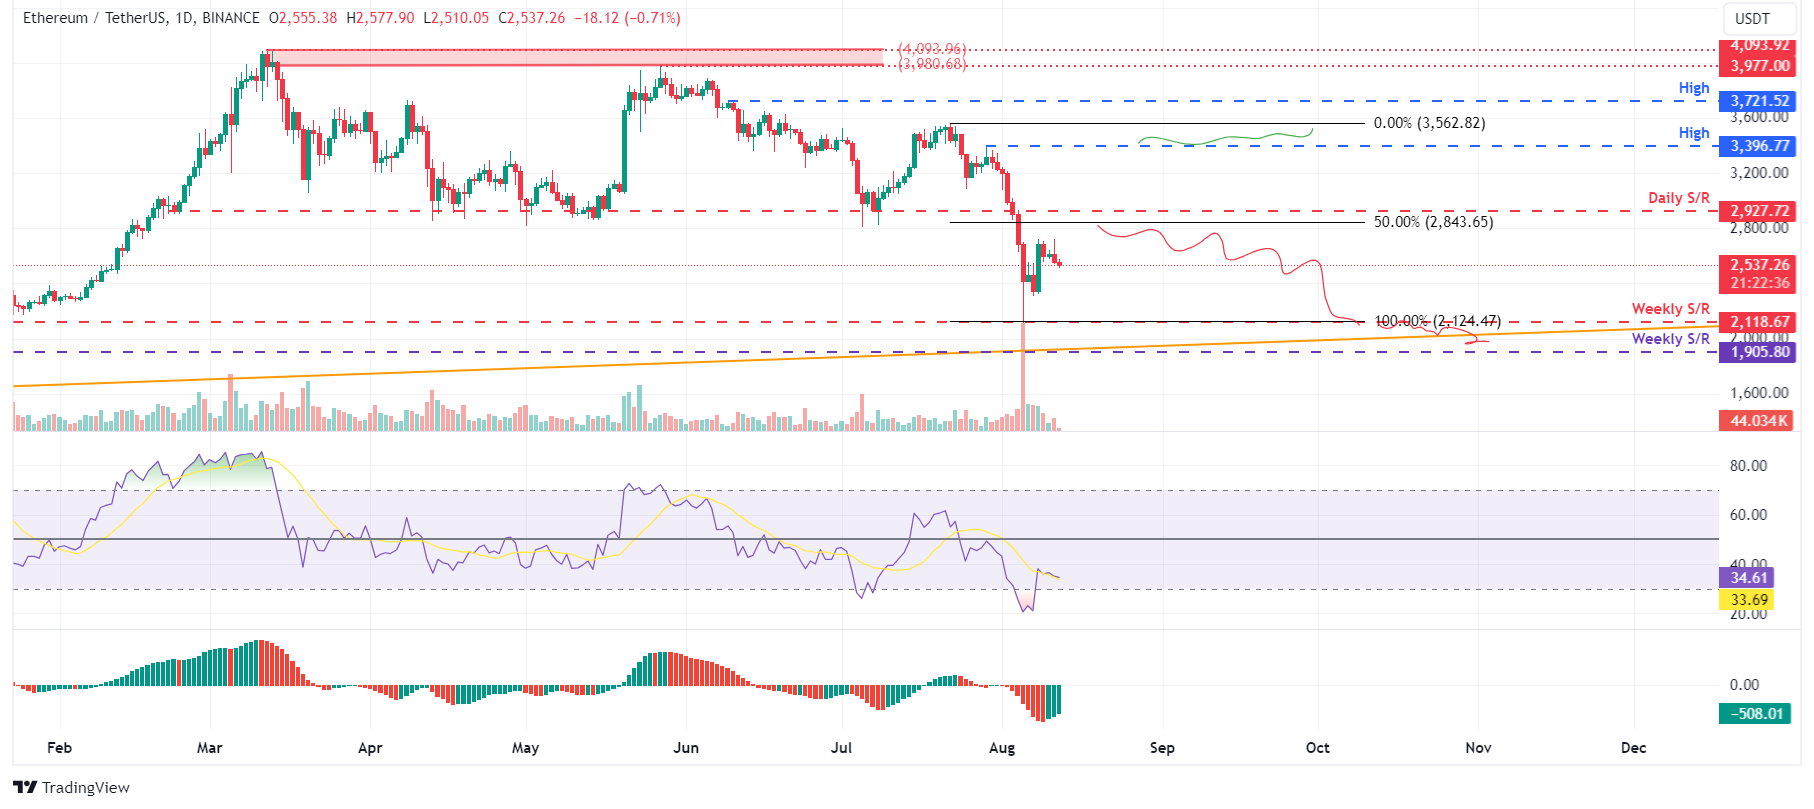
ETH/USDT daily chart
If Ethereum closes above $3,396, it could drive a 5% increase back toward the July high of $3,562.
Ripple's Potential Decline
Ripple's price is currently around $0.560, having found support at $0.544. However, if it breaks below this support, we could see a 10% decline to retest the $0.492 level. The daily RSI has also slipped below its neutral level, reinforcing the bearish outlook.
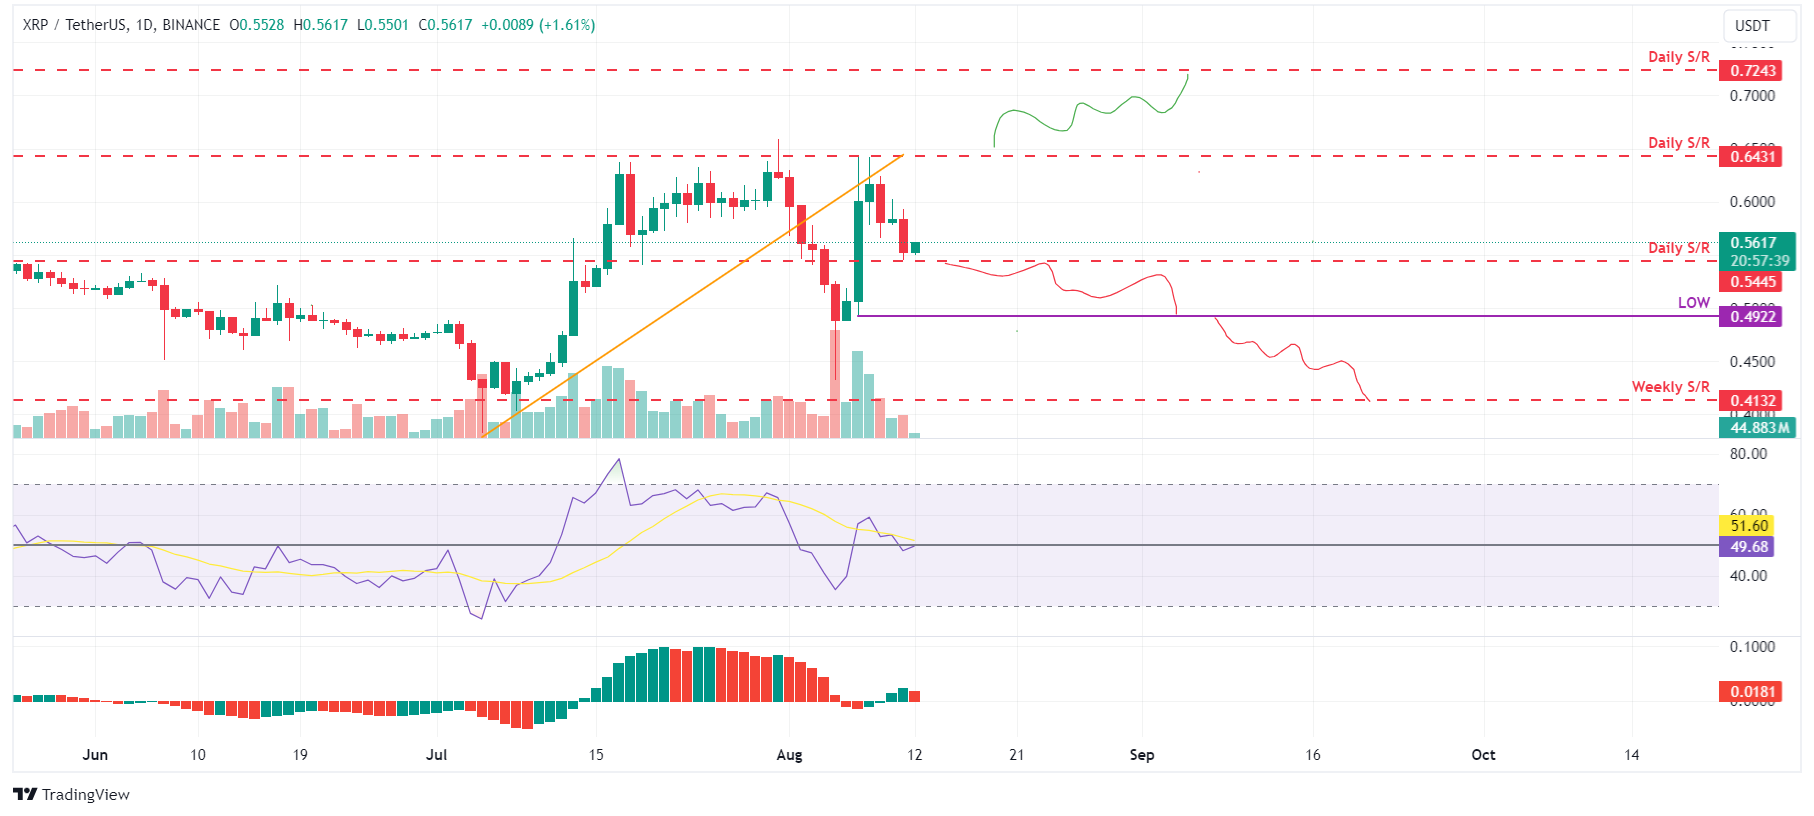
XRP/USDT daily chart
If Ripple closes above $0.643, it may change the market structure and push towards a 12% increase to the next resistance at $0.724.


Comments
Join Our Community
Sign up to share your thoughts, engage with others, and become part of our growing community.
No comments yet
Be the first to share your thoughts and start the conversation!