
Bitcoin Faces Rejection at $116,000
Bitcoin price is trading in the red below $114,000 after failing to break through the $116,000 resistance level. The 50-day Exponential Moving Average (EMA) at $113,058 is now a critical support level. A break below this could see BTC testing the psychological $110,000 support.
- RSI at 44 indicates bearish momentum.
- MACD shows a bearish crossover, reinforcing the downtrend.
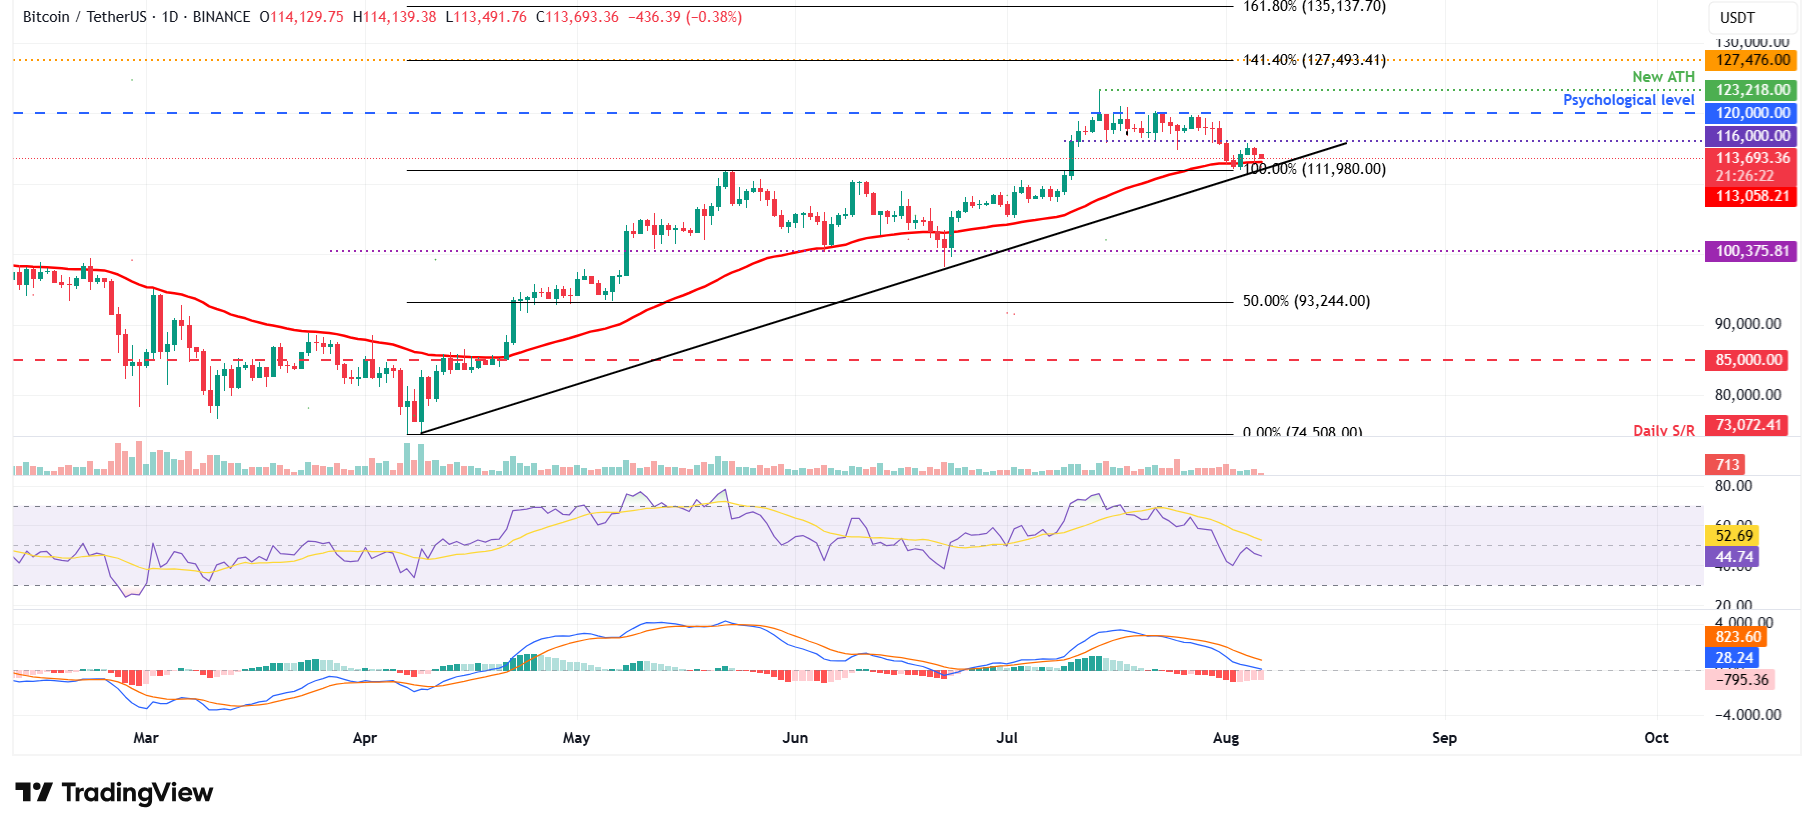
BTC/USDT daily chart
Ethereum Tests $3,730 Resistance
Ethereum price recovered 10.25% from its 78.6% Fibonacci retracement level at $3,392 but faced rejection at $3,730. Currently trading around $3,588, ETH risks falling back to $3,392 if the correction continues.
- RSI at 56 suggests bullish momentum but remains contested.
- MACD maintains a bearish crossover.
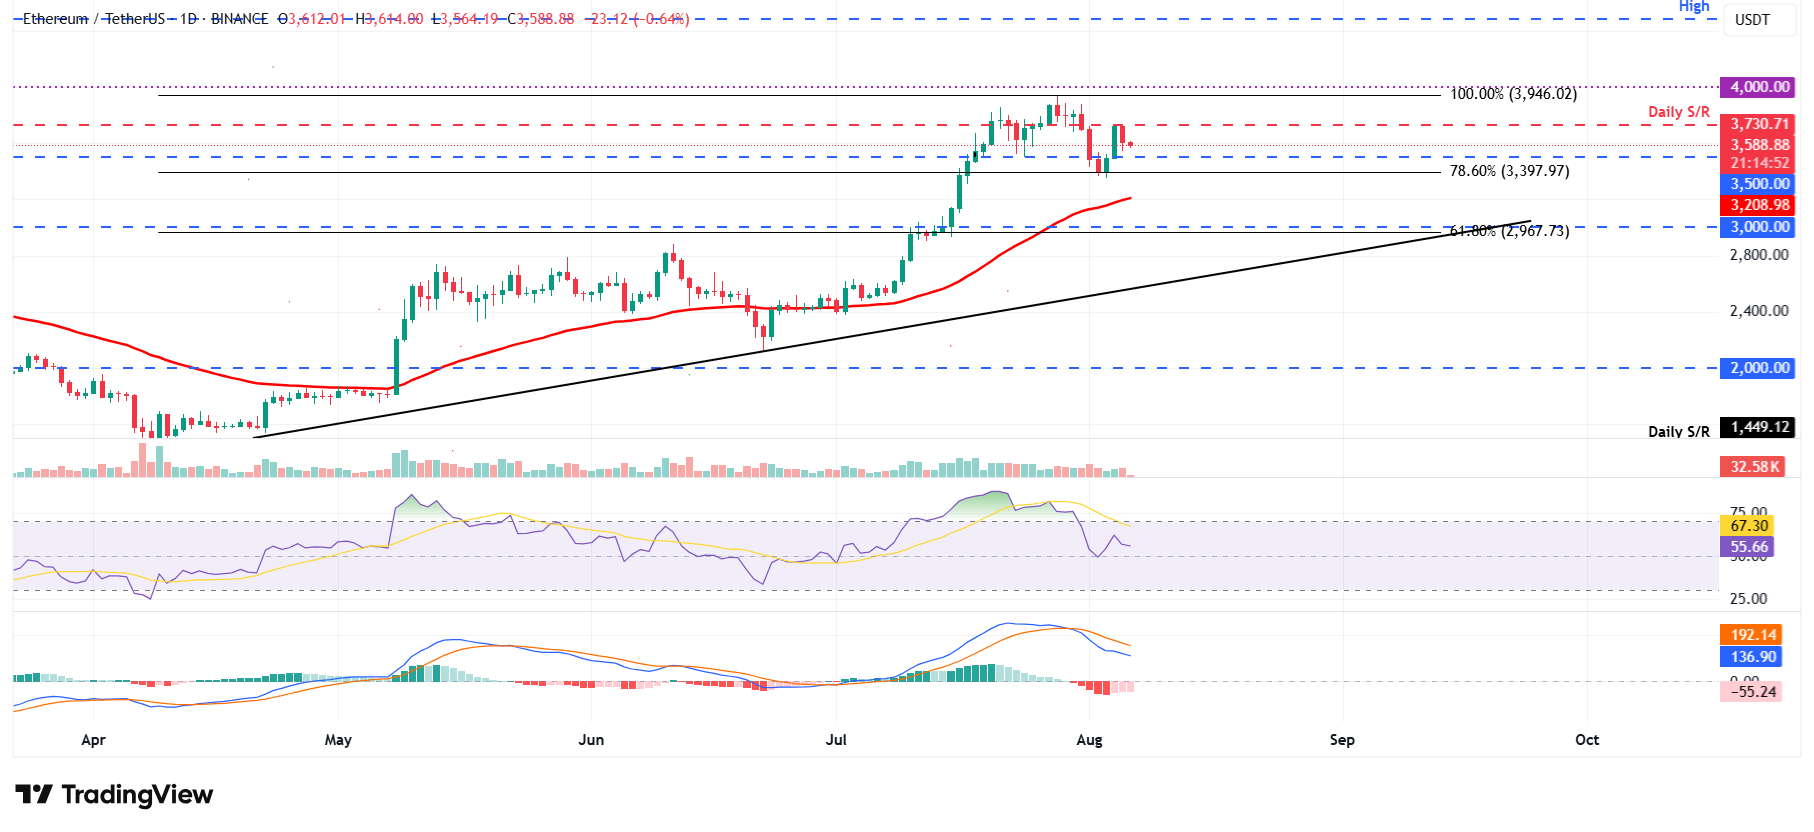
ETH/USDT daily chart
Ripple’s XRP Shows Weakness
XRP rebounded from the 50-day EMA at $2.80 but failed to sustain momentum, now trading below $2.92. A further drop could see it retesting $2.80.
- RSI slipping below 50 signals fading bullish strength.
- MACD aligns with the bearish outlook.
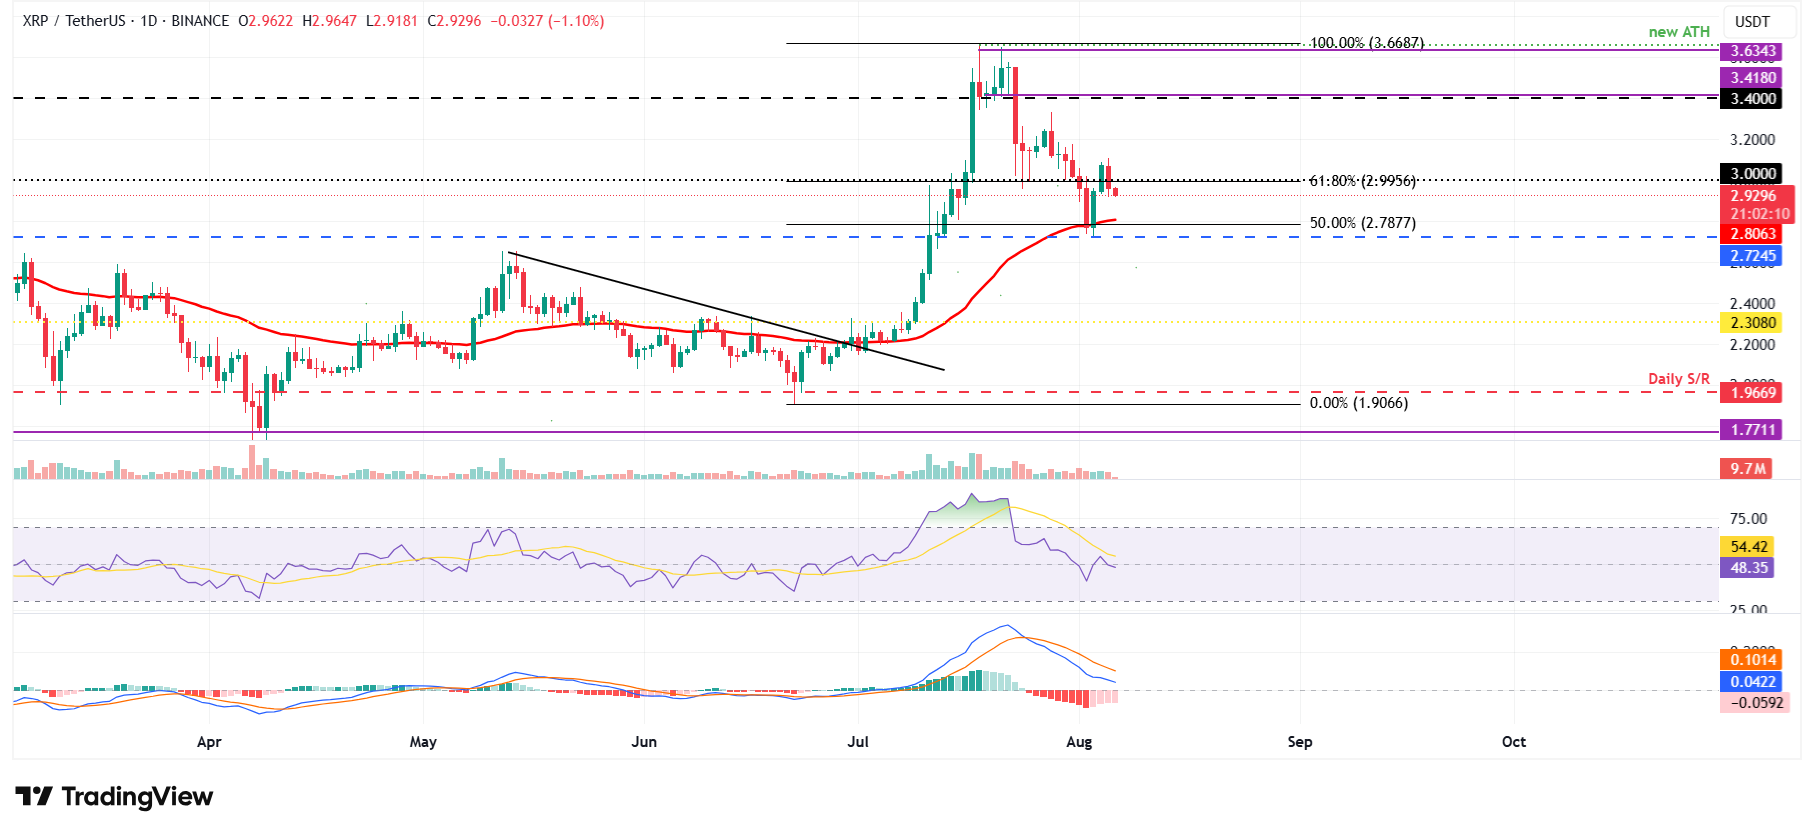
XRP/USDT daily chart


Comments
Join Our Community
Sign up to share your thoughts, engage with others, and become part of our growing community.
No comments yet
Be the first to share your thoughts and start the conversation!