
Bitcoin Shows Signs of Volatility Post $100K Milestone
Bitcoin (BTC) rebounds to $97,000 after a volatile drop to $90,500, following its $100K milestone touched the previous day. The price surged past the six-figure mark, reaching a high of $104,088, then fell sharply but recovered to close above $96,900. As of now, BTC hovers around $97,800. The Relative Strength Index (RSI) on the daily chart reads 64, indicating weak bullish momentum. If BTC continues to decline, it could retest the $90,000 support level.
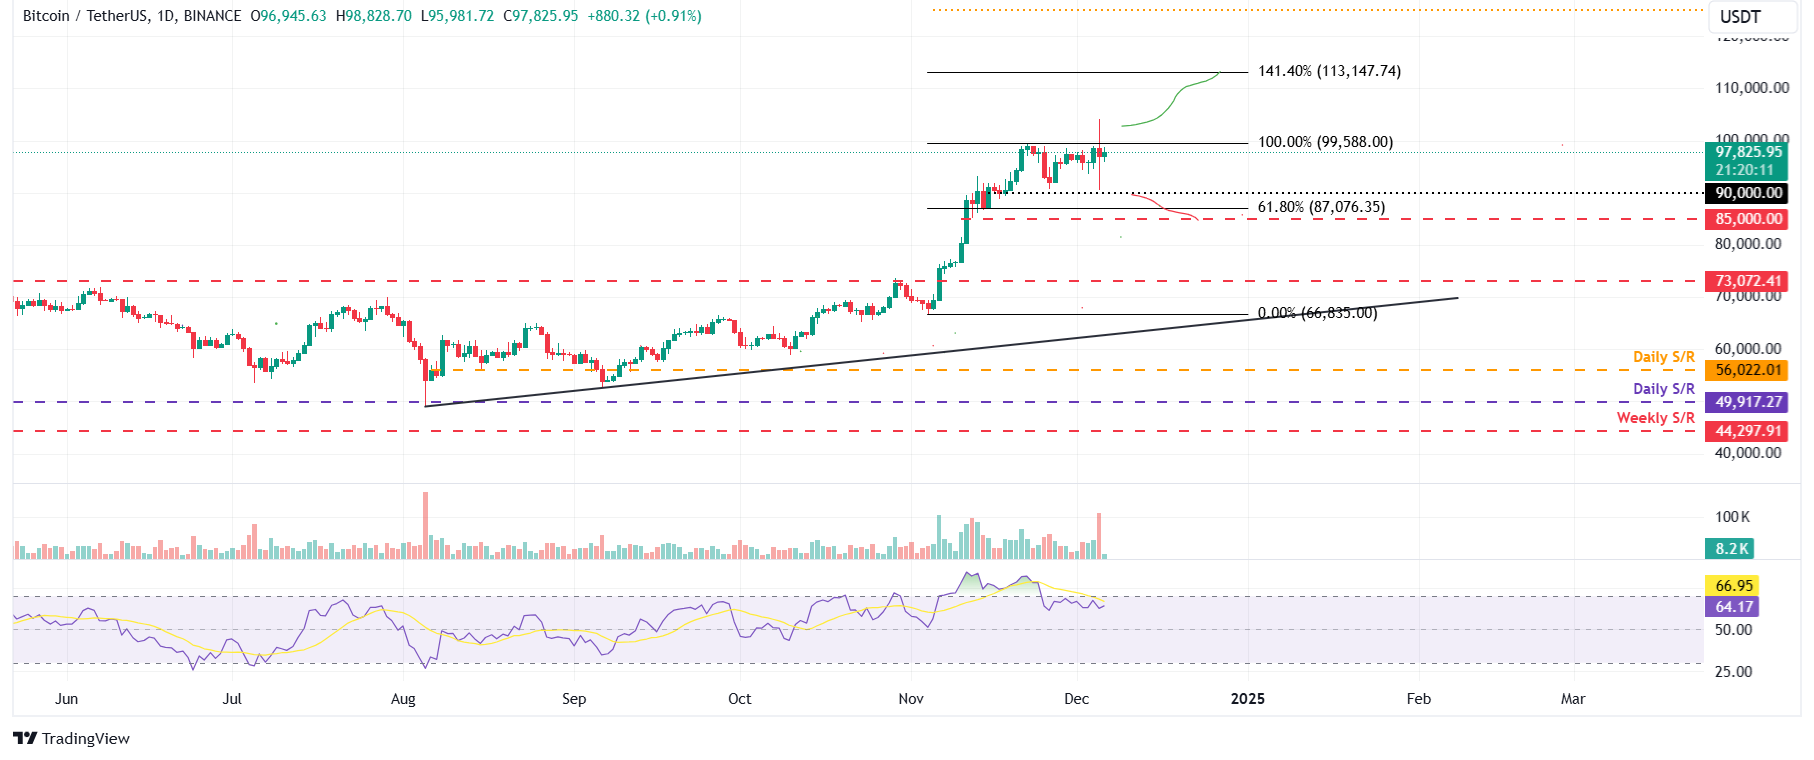
BTC/USDT daily chart
However, if BTC maintains its upward momentum, it could reach its new all-time high of $104,088.
Ethereum Bulls Eye the $4,000 Mark
Ethereum (ETH) maintains bullish momentum, holding above the weekly level of $3,454, suggesting a potential rally toward $4,000. The RSI indicator reads 70, indicating bullish momentum is gaining traction. If the $3,454 level holds, ETH could extend the rally to retest the psychologically important $4,000 level.
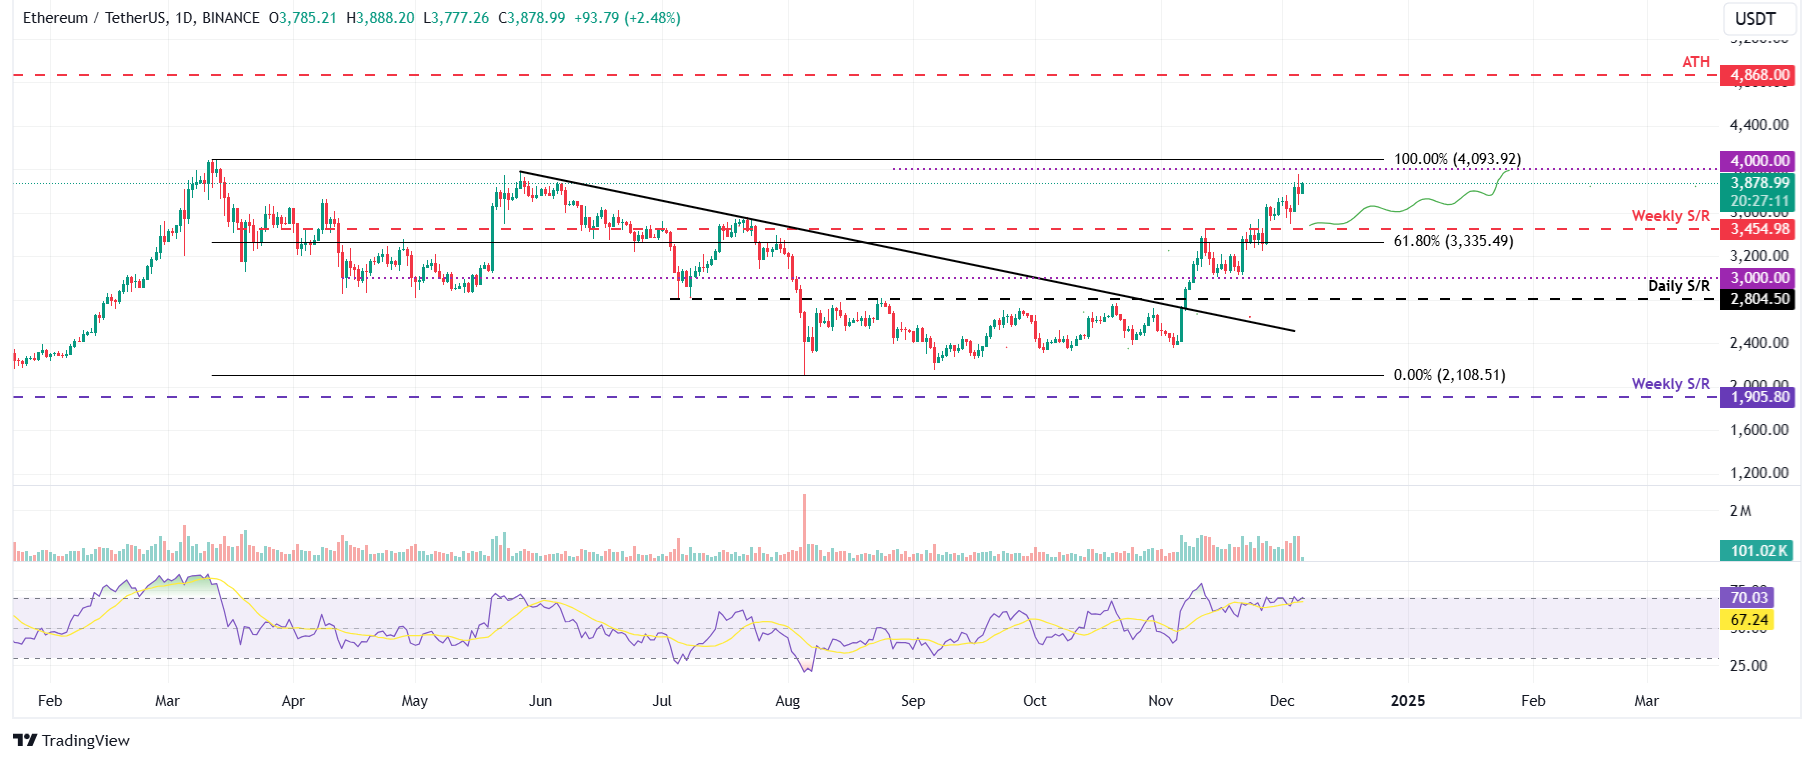
ETH/USDT daily chart
Conversely, if ETH declines below $3,454, it could face a pullback to $3,335.
Ripple Bulls Show Signs of Exhaustion
Ripple (XRP) surged over 18% earlier this week, reaching a six-year high of $2.90, but has since declined 17.6%. Currently trading around $2.31, XRP may retest the $1.96 support level if it continues to decline. The RSI stands at 72, indicating overbought conditions and suggesting an increasing risk of a correction.
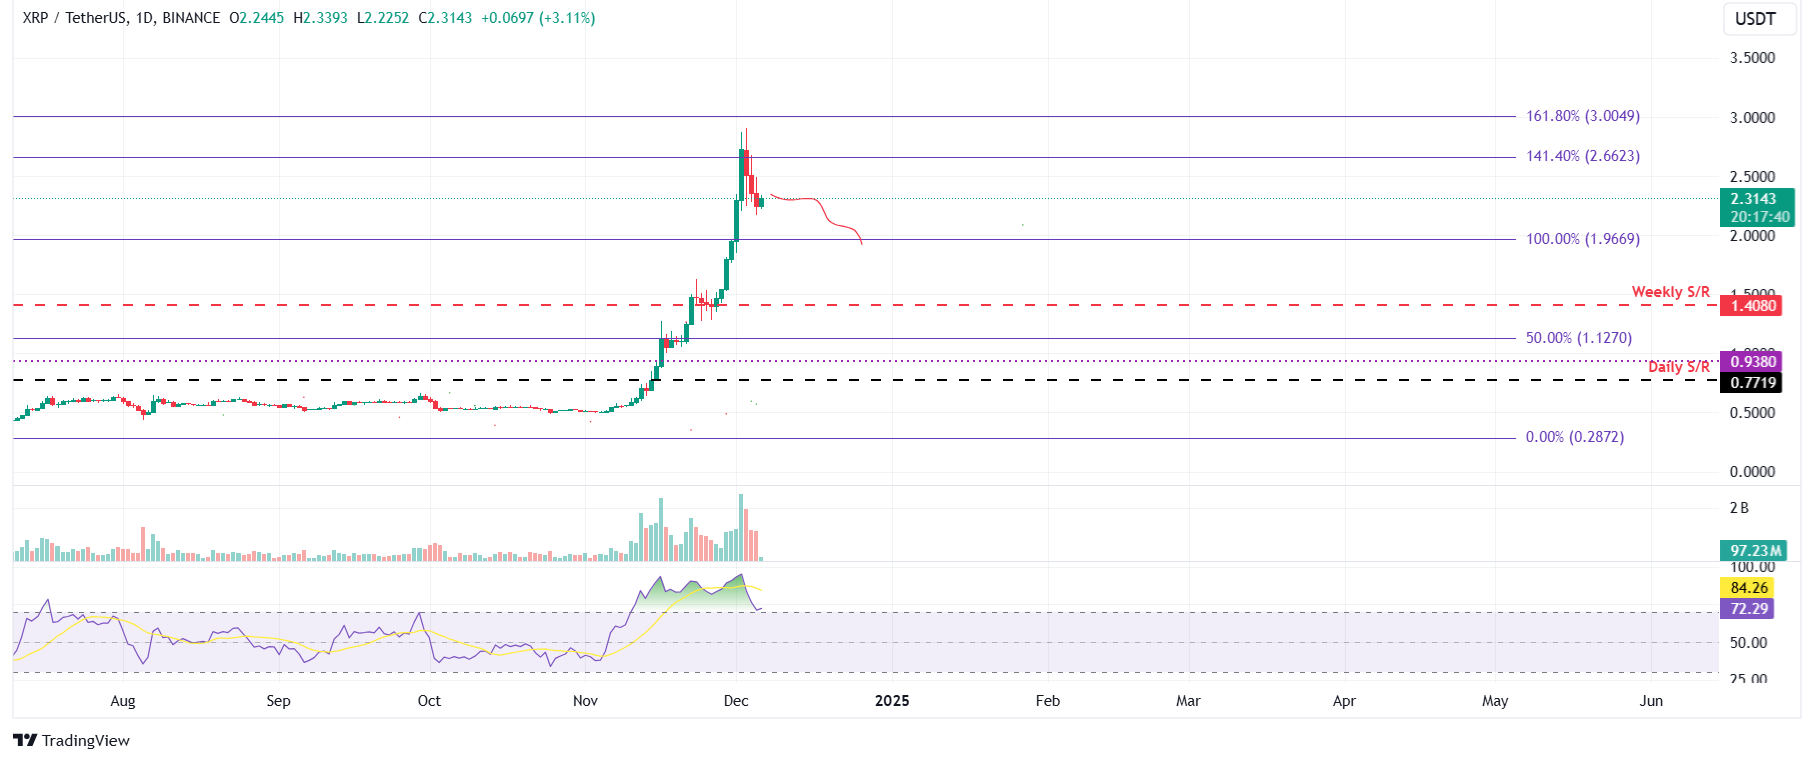
XRP/USDT daily chart
However, if XRP recovers, it could target the $3.00 level again.


Comments
Join Our Community
Sign up to share your thoughts, engage with others, and become part of our growing community.
No comments yet
Be the first to share your thoughts and start the conversation!