
Bitcoin's recent price action has traders on edge as key support levels crumble. The cryptocurrency has fallen over 3% this week, breaking below the critical 50- and 100-day simple moving averages (SMA). These indicators have flatlined for the first time since April, signaling a potential shift in momentum that bulls should watch closely.

Social Media Buzz: A Contrarian Signal?
Amid the decline, social media platforms like Reddit, Telegram, and X have seen a surge in "buy the dip" mentions, reaching their highest level in nearly a month. According to Santiment, a data tracking platform, this spike often acts as a contrarian indicator. When retail investors become overly optimistic, it can precede further price drops. Santiment notes that prices tend to move opposite to crowd expectations, suggesting that true buying opportunities emerge when optimism fades and panic selling begins.
Liquidity Analysis Points to $107,000 Support
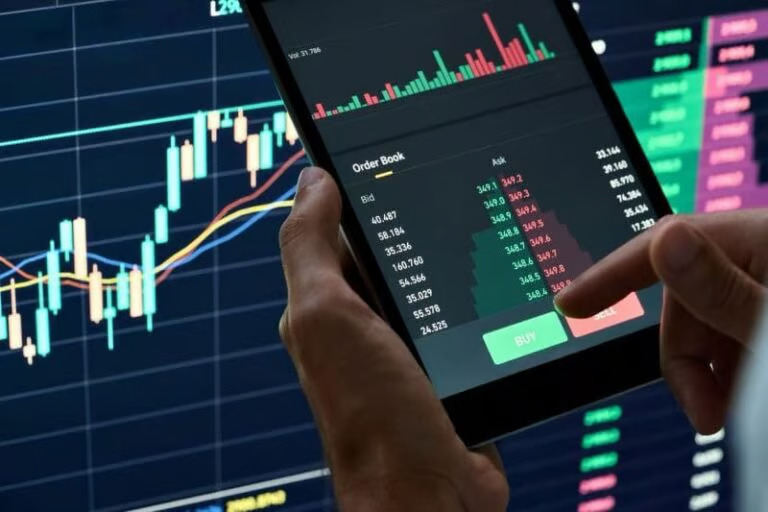
Order book liquidity analysis from Hyblock Capital reveals a significant concentration of buy and sell orders around $107,000. This level represents the largest liquidity cluster and could act as a "magnet" for Bitcoin's price, potentially drawing it lower to absorb supply and demand. Liquidity pools at $109,000 and $111,000 are also growing, but $107,000 stands out as a key zone where traders might place buy orders, creating potential support.
Understanding order book liquidity is crucial: it reflects market depth by showing the volume of orders at different price levels. Large liquidity clusters can stabilize prices by absorbing trades, but they can also attract price movements as algorithms and traders target these areas.

Comments
Join Our Community
Sign up to share your thoughts, engage with others, and become part of our growing community.
No comments yet
Be the first to share your thoughts and start the conversation!