Key Insights on Bitcoin's Future
Historical trends linked to the 200-week simple moving average (SMA) indicate that Bitcoin (BTC) has significant upward potential, especially as the U.S. faces renewed inflation challenges.
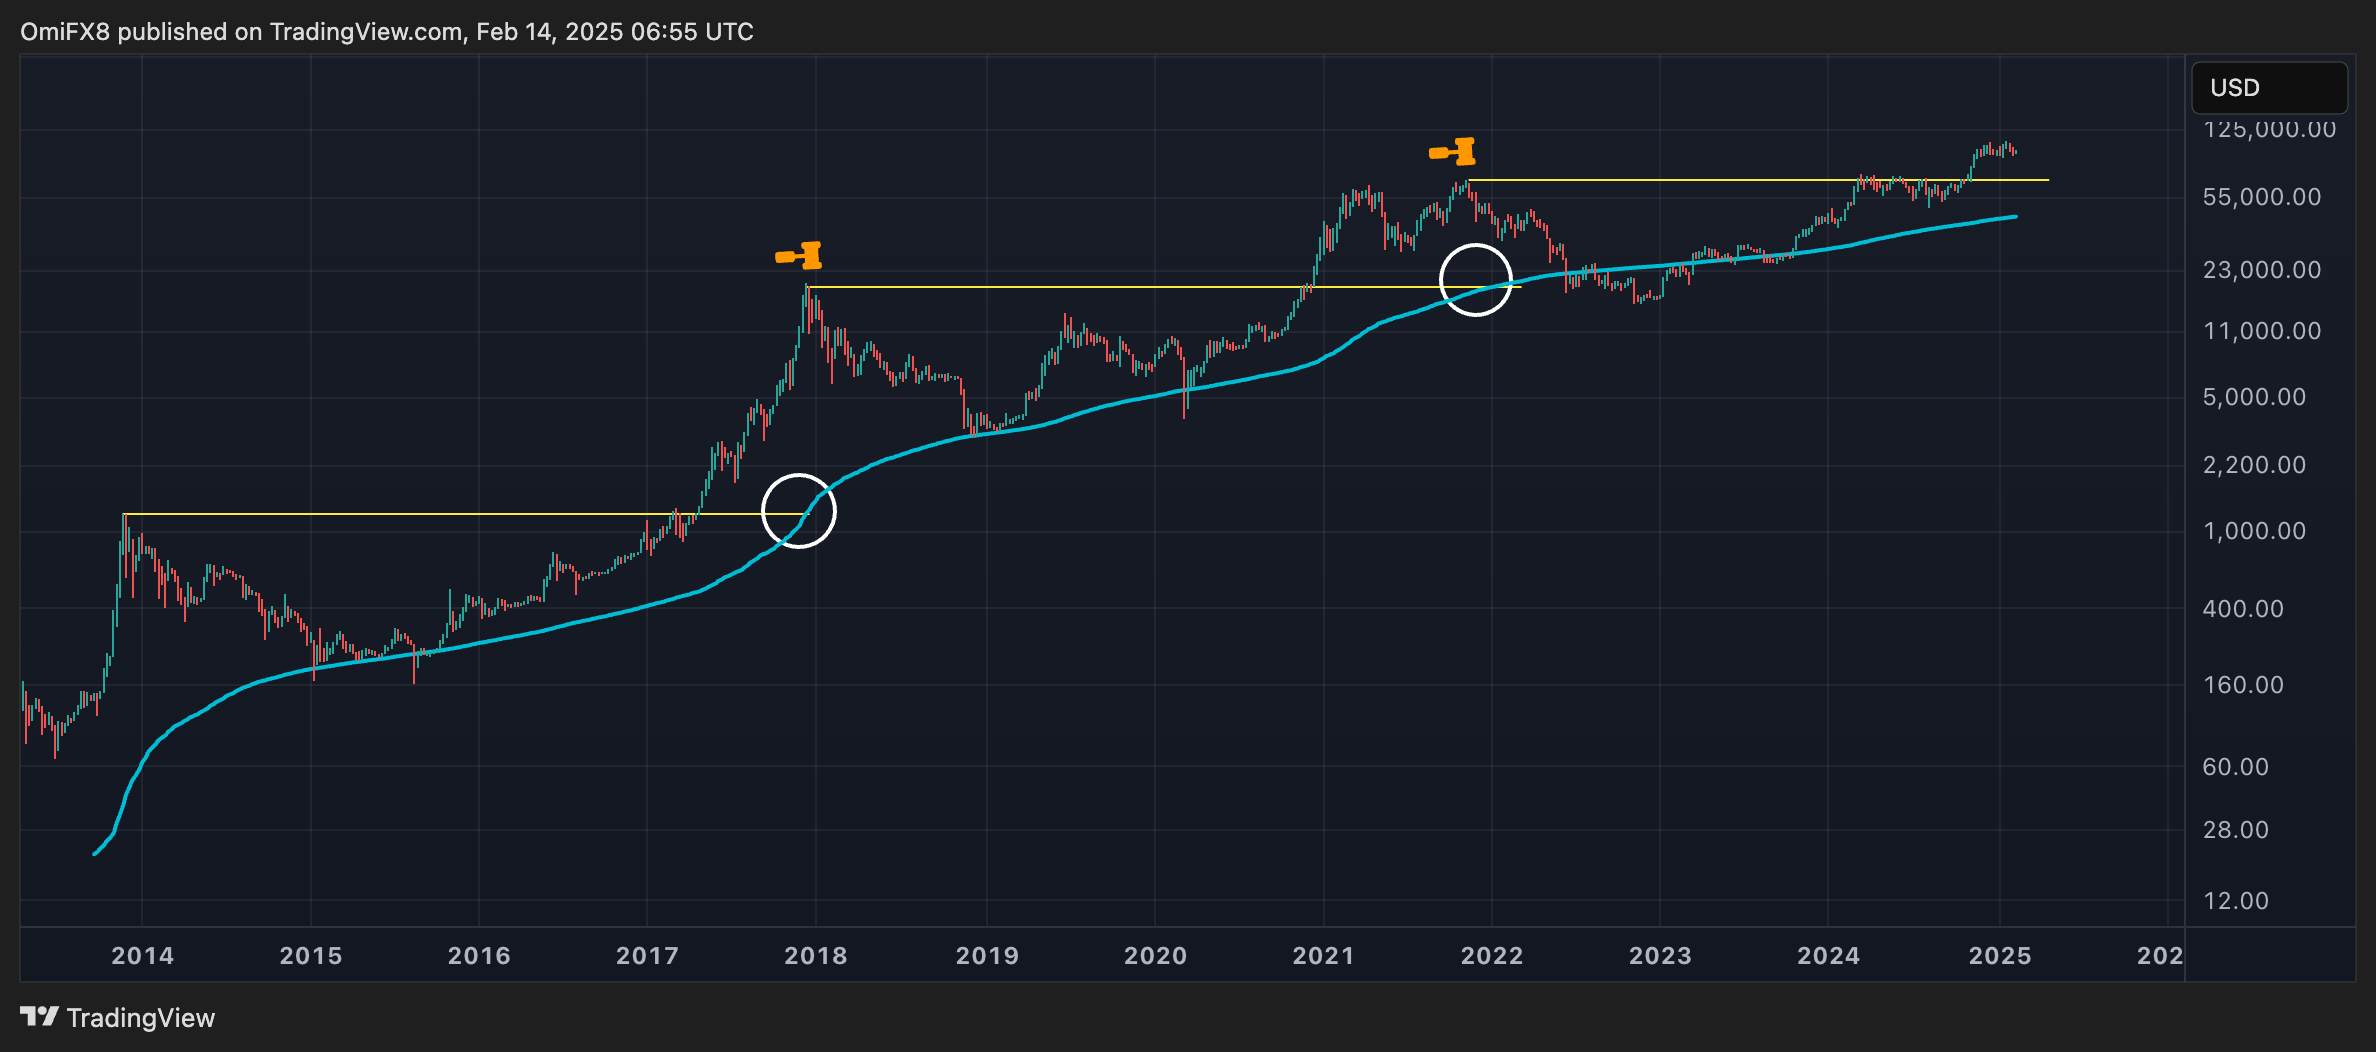
As of now, the 200-week SMA is at $44,200, a figure that remains well below the previous bull market peak of $69,000 recorded in November 2021. This discrepancy suggests that the current market could still have room for growth.
What You Need to Know
- The 200-week SMA tends to rise to the previous bull market's high by the end of the bull cycle.
- For instance, during the last bull market, the SMA peaked at $19,000, reflecting the previous highs of $69,000 from 2021.
- Similarly, in 2017, the bull market concluded with the SMA reaching over $1,200.
Current Market Dynamics
The ongoing price range for Bitcoin is currently between $90,000 and $110,000, and historical patterns suggest this will resolve positively, leading to a bullish trend.
Additionally, options pricing on Deribit supports this bullish outlook, with call options being more expensive than puts, indicating market expectations for rising prices. Notably, the most popular call option is at the $120K strike, showcasing a notional open interest exceeding $1.8 billion.
In summary, the historical performance of Bitcoin relative to the 200-week SMA suggests that the current market may have significant upside potential, with many indicators pointing towards a bullish resolution in the near future.


Comments
Join Our Community
Sign up to share your thoughts, engage with others, and become part of our growing community.
No comments yet
Be the first to share your thoughts and start the conversation!