
Market Overview: Bitcoin's Struggle Below $105K
Bitcoin (BTC) is currently trading below $105,000, showing minor losses as the cryptocurrency market consolidates after last week's sell-off. The recovery attempt earlier this week lacked momentum, failing to breach the $107,000 resistance level. Meanwhile, Ethereum (ETH) holds steady around the $2,600 support, hinting at a potential breakout towards $3,000.
Fading Retail and Institutional Demand
The recent pullback in Bitcoin's price is attributed to declining retail and institutional demand. Spot Bitcoin ETFs have seen dwindling inflows, even recording negative flows for three consecutive days last week. This trend reflects a broader market sentiment shift, possibly influenced by geopolitical tensions and macroeconomic uncertainties.
- Bitcoin Open Interest (OI) has dropped to $70.70 million, indicating reduced market participation.
- Long position liquidations totaled $36 million in the past 24 hours, compared to $7 million in short positions.
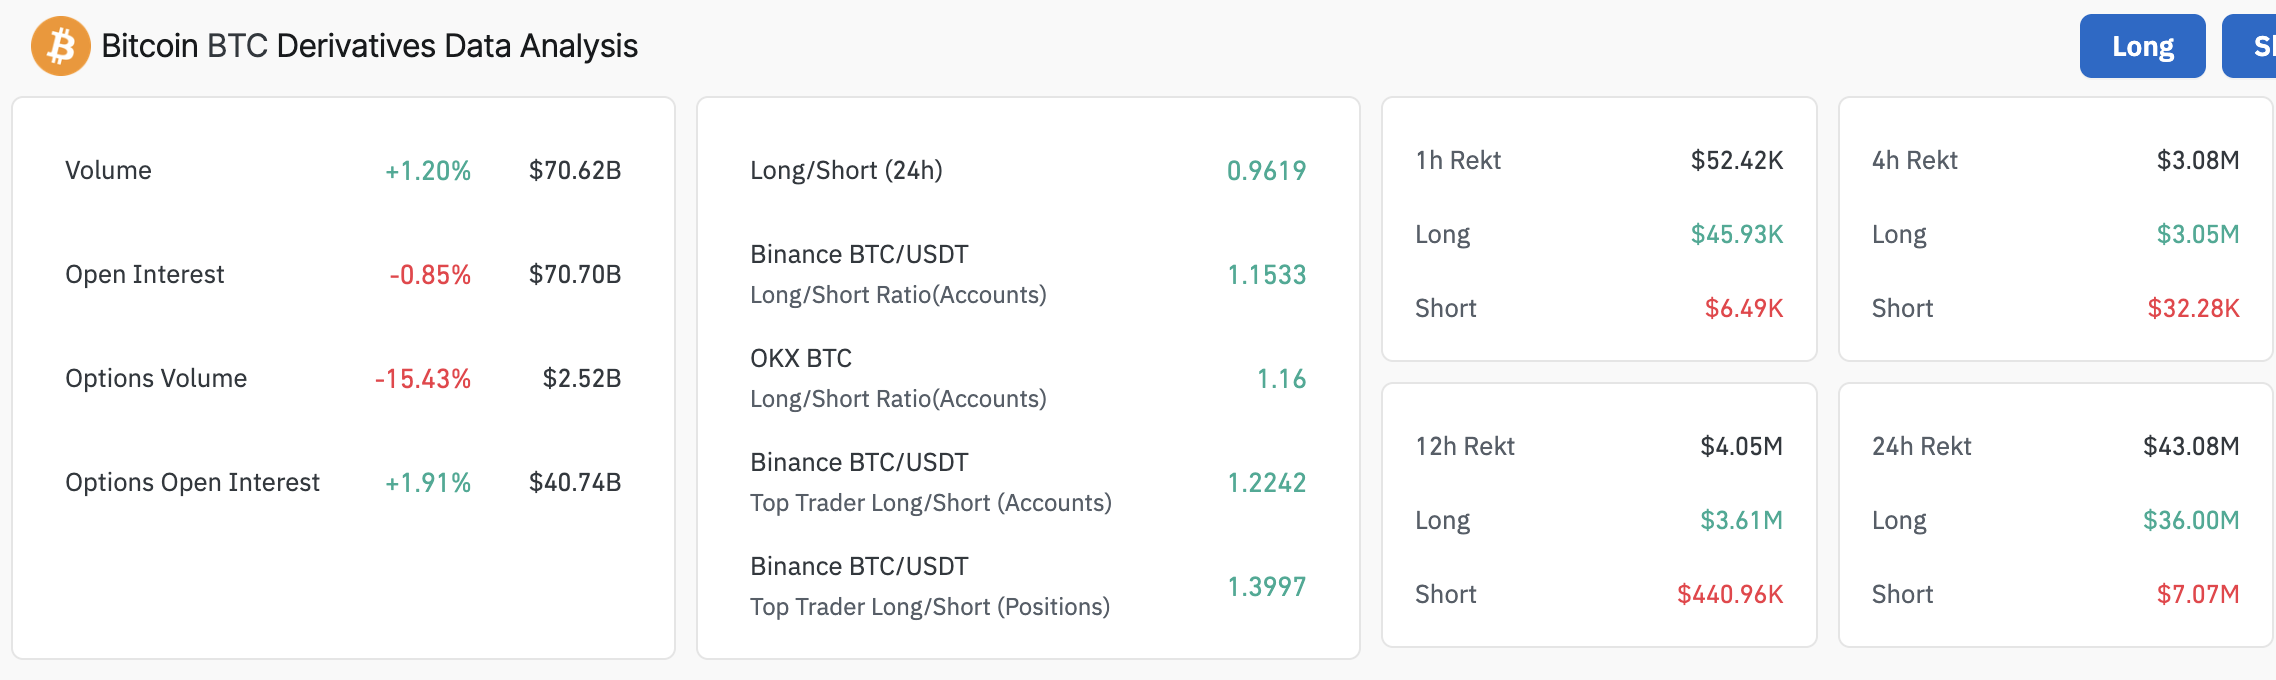 Bitcoin Open Interest | Source: CoinGlass
Data Spotlight: Retail Investors Retreat
Retail investor activity has notably decreased since Bitcoin's all-time high of $111,980 on May 22. CryptoQuant data shows retail transfer volume (transactions under $10,000) dropping from $423 million to $408 million. This sensitivity to price corrections suggests retail investors are stepping back, which could impact Bitcoin's bull run sustainability.
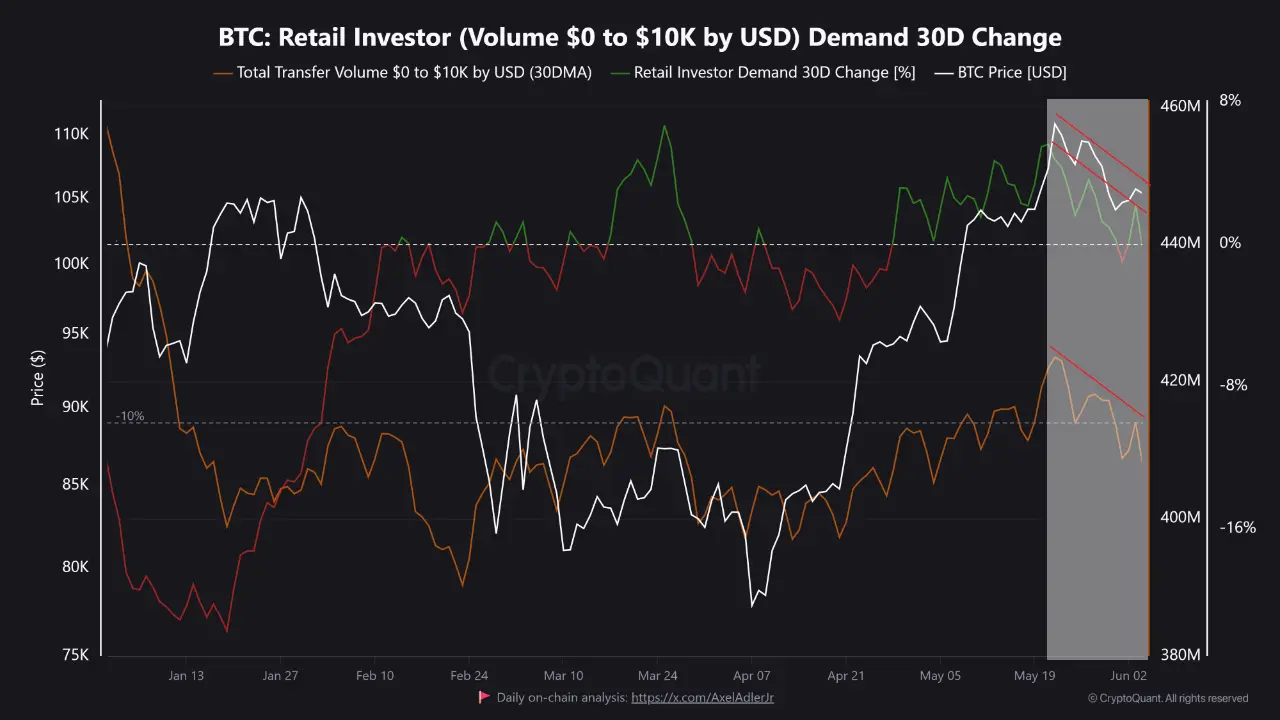 Bitcoin retail investor transfer volume | Source: CryptoQuant
Ethereum's Steady Inflows
In contrast, Ethereum spot ETFs have maintained steady inflows, with $57 million net inflows recorded on Wednesday. This marks 13 consecutive days of positive flows, underscoring stronger institutional confidence in ETH compared to BTC.
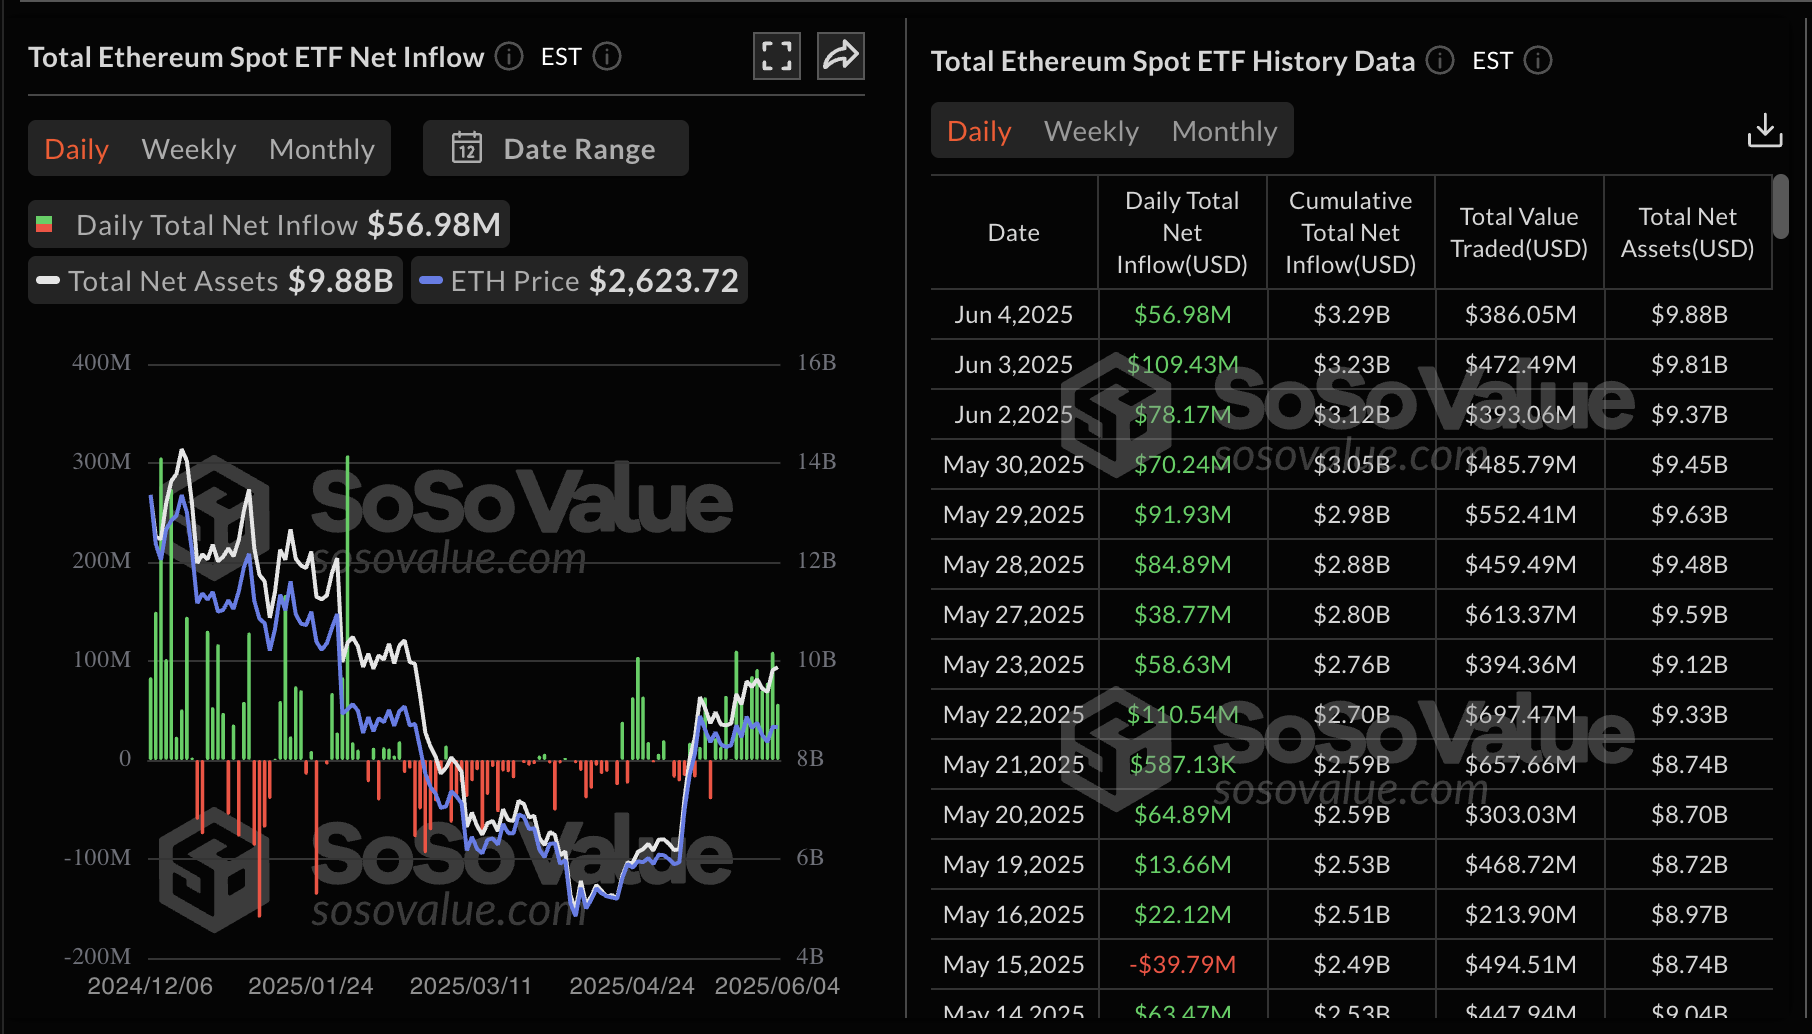 Ethereum spot ETF stats | Source: SoSoValue
Technical Analysis: Bitcoin's Bearish Signals
Bitcoin's technical outlook shows bearish signals, with the Moving Average Convergence Divergence (MACD) indicator sustaining a sell signal since May 26. The price is currently hovering around $104,834, with potential support levels at $103,000 and the 50-day EMA at $100,955.
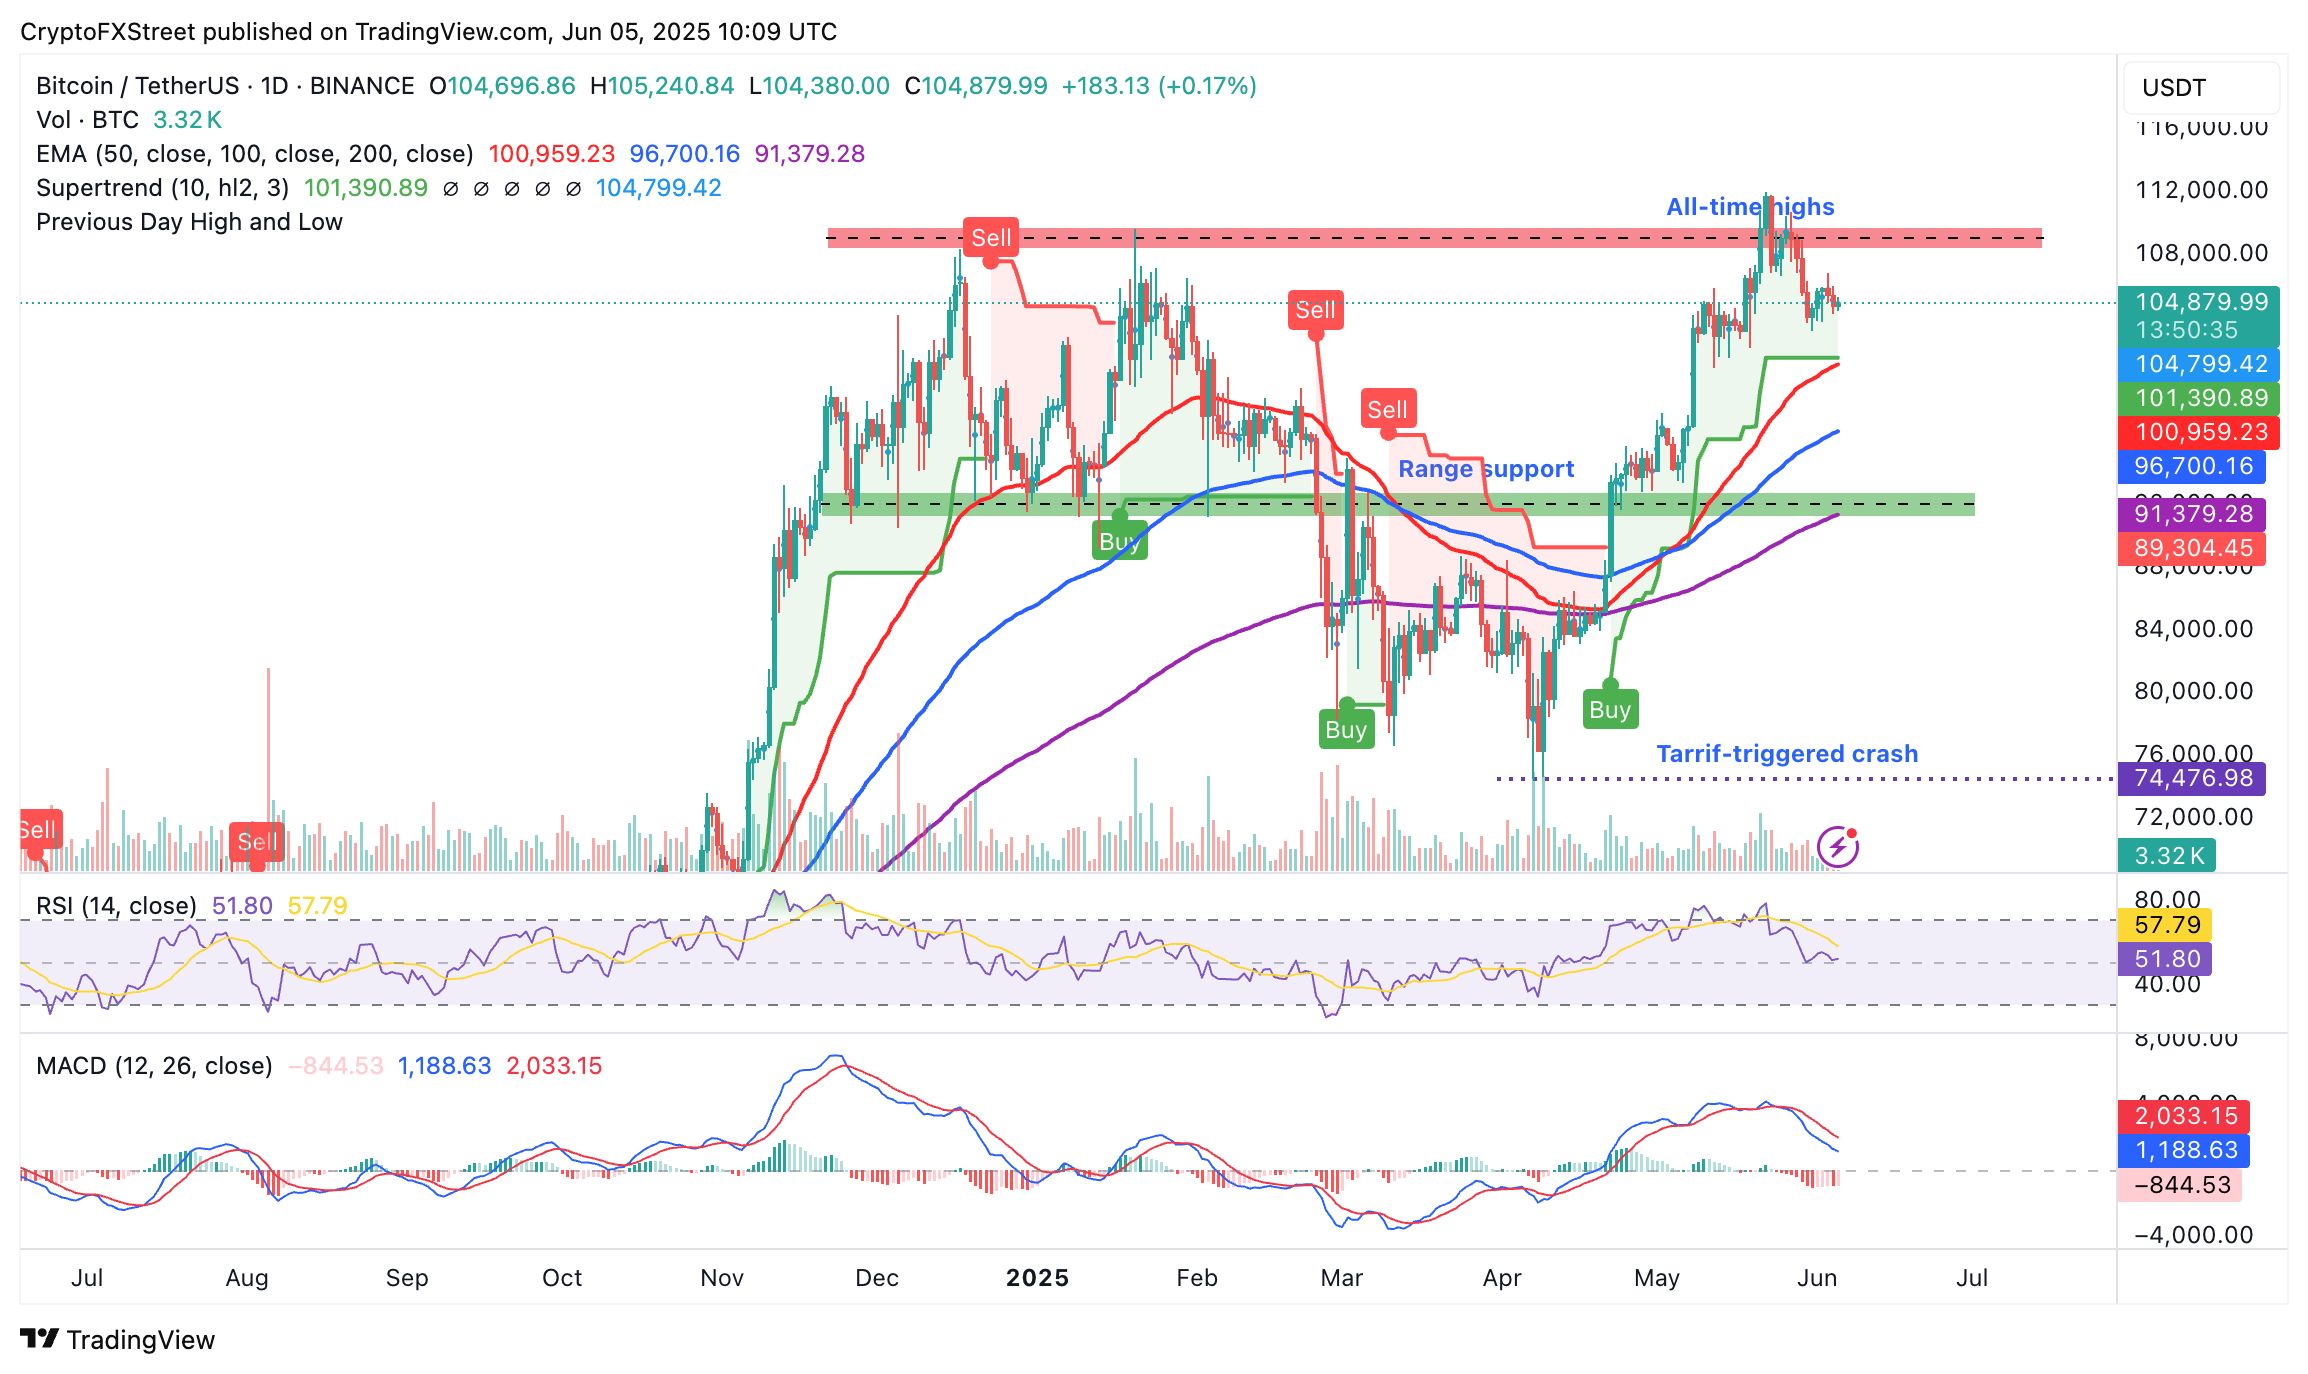 BTC/USD daily chart
Ethereum's Bullish Structure
Ethereum's bullish structure remains intact, supported by the SuperTrend indicator's buy signal. However, a MACD sell signal advises caution, with key support levels at the 200-day EMA ($2,462) and the 50-day EMA ($2,339).
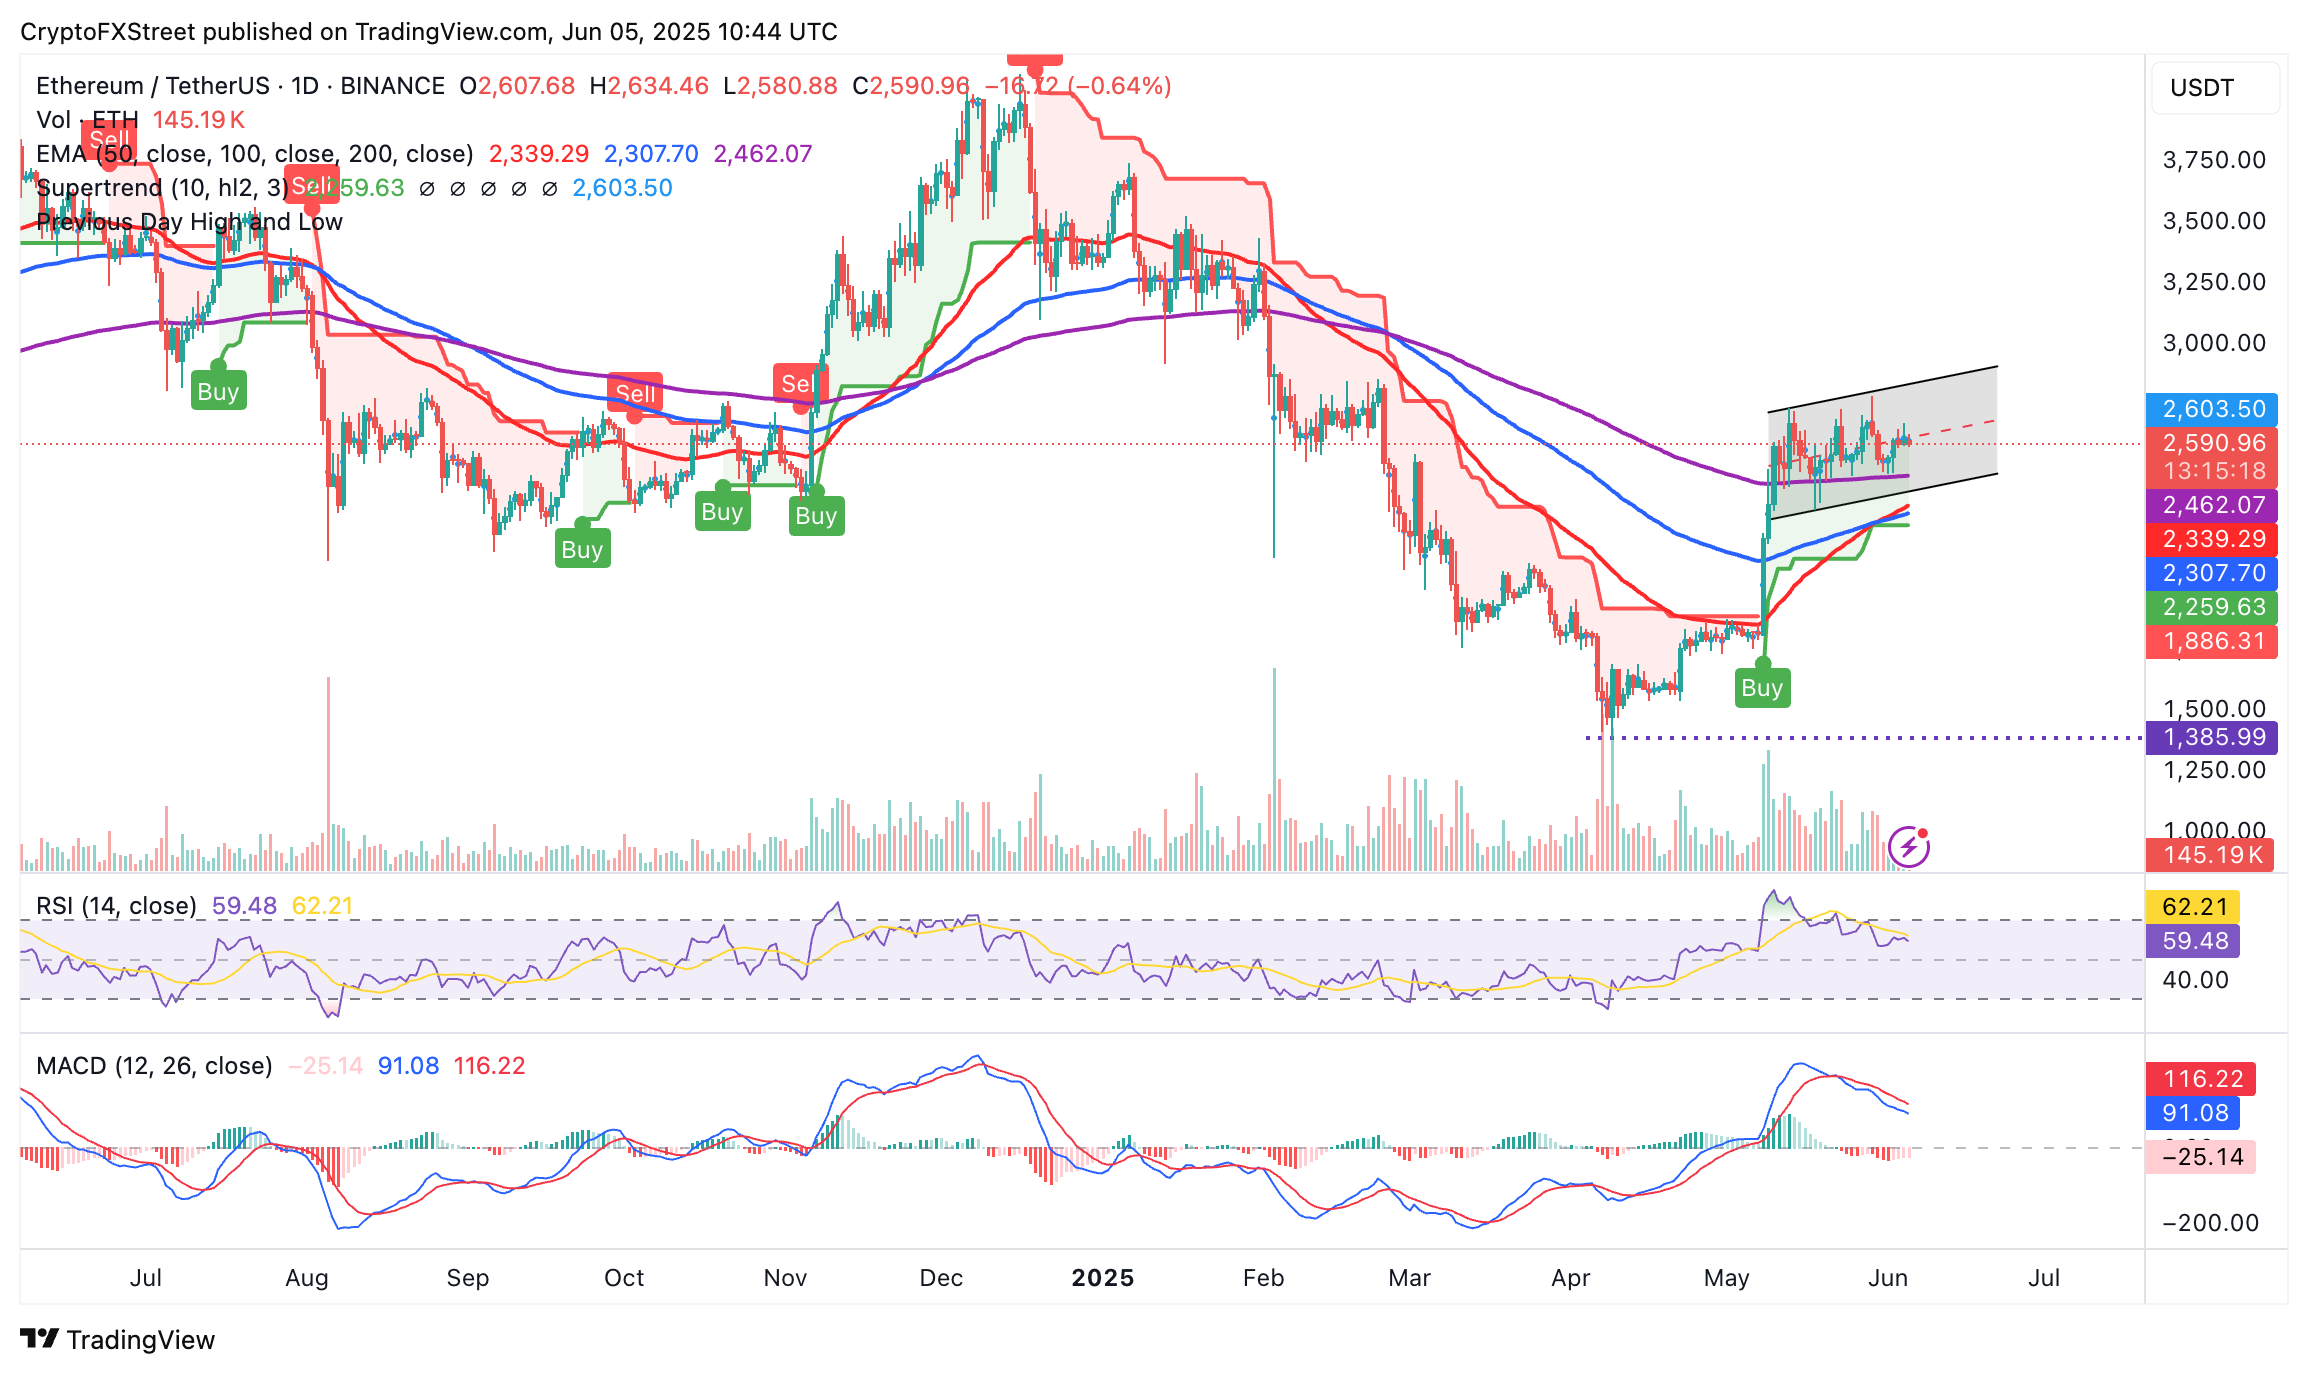 ETH/USDT daily chart


Comments
Join Our Community
Sign up to share your thoughts, engage with others, and become part of our growing community.
No comments yet
Be the first to share your thoughts and start the conversation!